Plot the patients' jackknife co-clustering probability
Source:R/plot_jackknife_coclustering.R
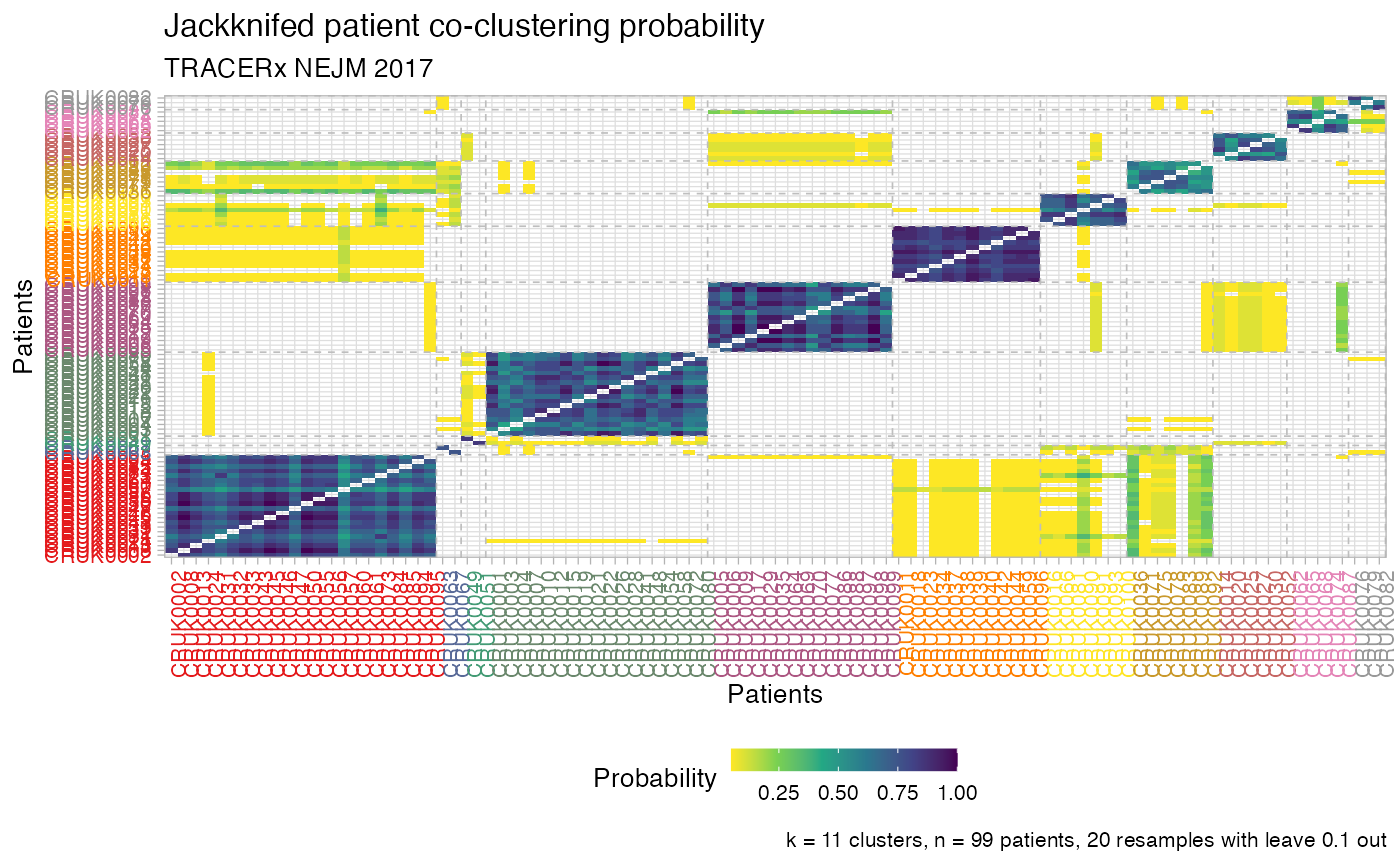
plot_jackknife_coclustering.RdThis function plots a raster of the patients' jackknife co-clustering probability.
The input matrix to this function can be obtained via Jackknife_patient_coclustering;
in the visualisation the patient ids are coloured and ordered according to the clusters in the
input dataset, which can be obtained via Cluster.
plot_jackknife_coclustering(x, cluster_palette = distinct_palette_few)Arguments
Value
A ggplot figure.
See also
Other Plotting functions:
distinct_palette_few(),
distinct_palette_many(),
gradient_palette(),
plot_DET_index(),
plot_clusters(),
plot_dendrogram(),
plot_drivers_clonality(),
plot_drivers_graph(),
plot_drivers_occurrence(),
plot_jackknife_cluster_stability(),
plot_jackknife_trajectories_stability(),
plot_patient_CCF_histogram(),
plot_patient_data(),
plot_patient_mutation_burden(),
plot_patient_oncoprint(),
plot_patient_trees_scores()
Examples
# Data released in the 'evoverse.datasets'
data('TRACERx_NEJM_2017_REVOLVER', package = 'evoverse.datasets')

plot_jackknife_coclustering(TRACERx_NEJM_2017_REVOLVER)