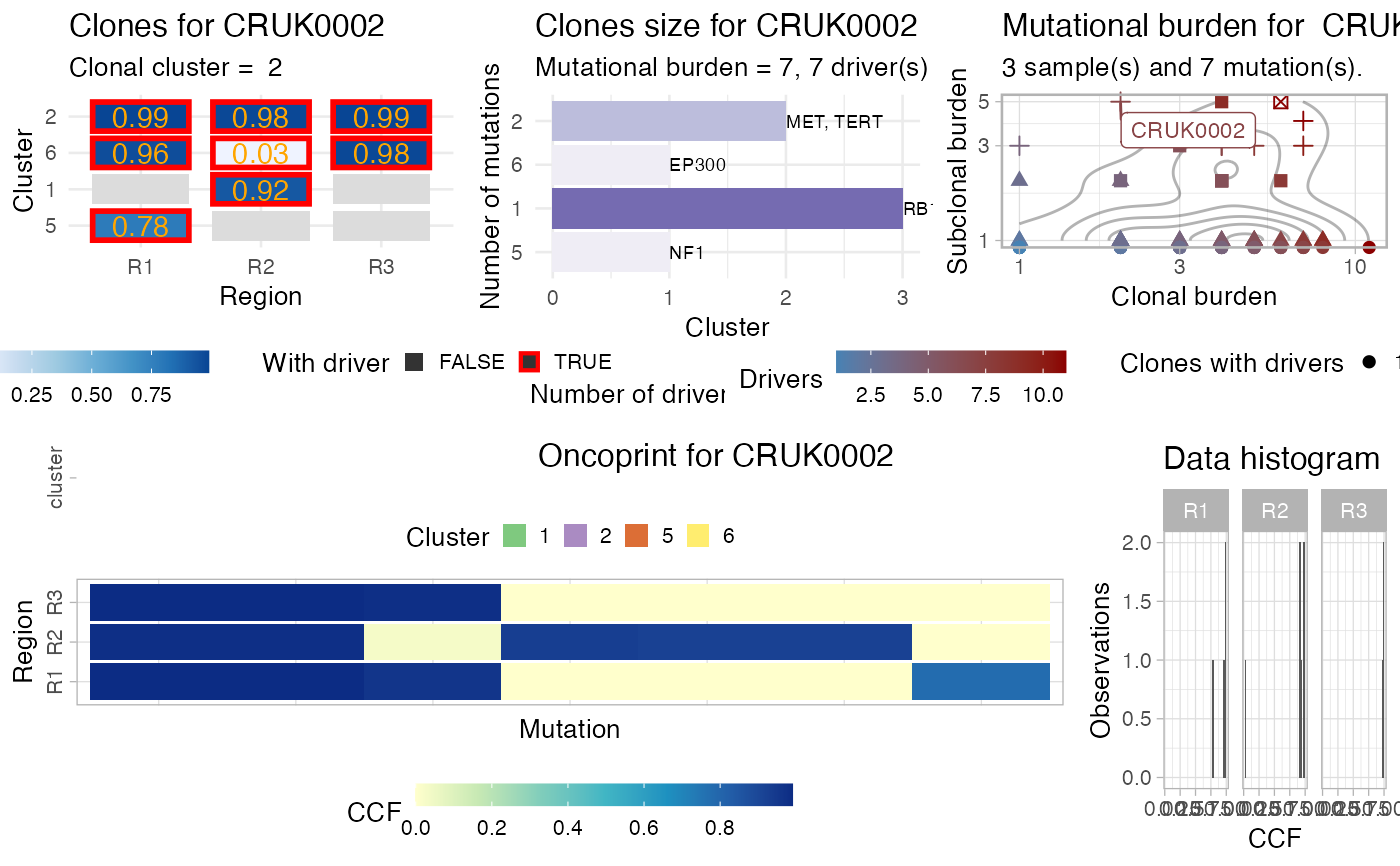
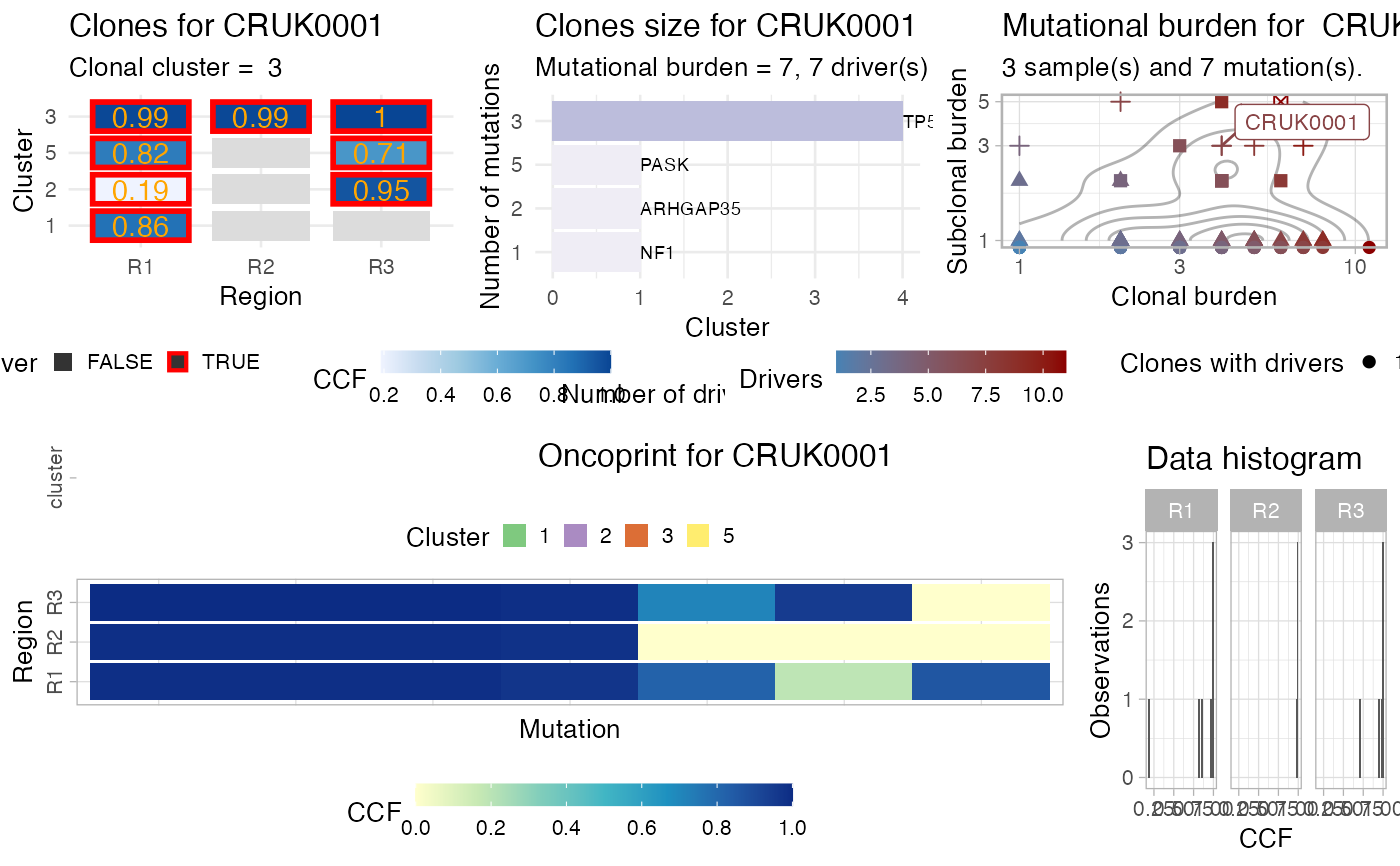
This function creates a complex plot for the
data of a patient, assembling plots returned from the following
functions: 1) plot_patient_CCF_histogram,
2) plot_patient_mutation_burden, 3) plot_patient_oncoprint.
plot_patient_data(x, patient, ...)Arguments
Value
A figure assembled with ggpubr.
See also
Other Plotting functions:
distinct_palette_few(),
distinct_palette_many(),
gradient_palette(),
plot_DET_index(),
plot_clusters(),
plot_dendrogram(),
plot_drivers_clonality(),
plot_drivers_graph(),
plot_drivers_occurrence(),
plot_jackknife_cluster_stability(),
plot_jackknife_coclustering(),
plot_jackknife_trajectories_stability(),
plot_patient_CCF_histogram(),
plot_patient_mutation_burden(),
plot_patient_oncoprint(),
plot_patient_trees_scores()
Examples
# Data released in the 'evoverse.datasets'
data('TRACERx_NEJM_2017_REVOLVER', package = 'evoverse.datasets')

plot_patient_data(TRACERx_NEJM_2017_REVOLVER, 'CRUK0001')
#> Warning: Removed 4 rows containing missing values or values outside the scale range
#> (`geom_text()`).
#> Warning: log-10 transformation introduced infinite values.
#> Warning: log-10 transformation introduced infinite values.
#> Warning: Removed 54 rows containing non-finite outside the scale range
#> (`stat_density2d()`).

plot_patient_data(TRACERx_NEJM_2017_REVOLVER, 'CRUK0002')
#> Warning: Removed 4 rows containing missing values or values outside the scale range
#> (`geom_text()`).
#> Warning: log-10 transformation introduced infinite values.
#> Warning: log-10 transformation introduced infinite values.
#> Warning: Removed 54 rows containing non-finite outside the scale range
#> (`stat_density2d()`).