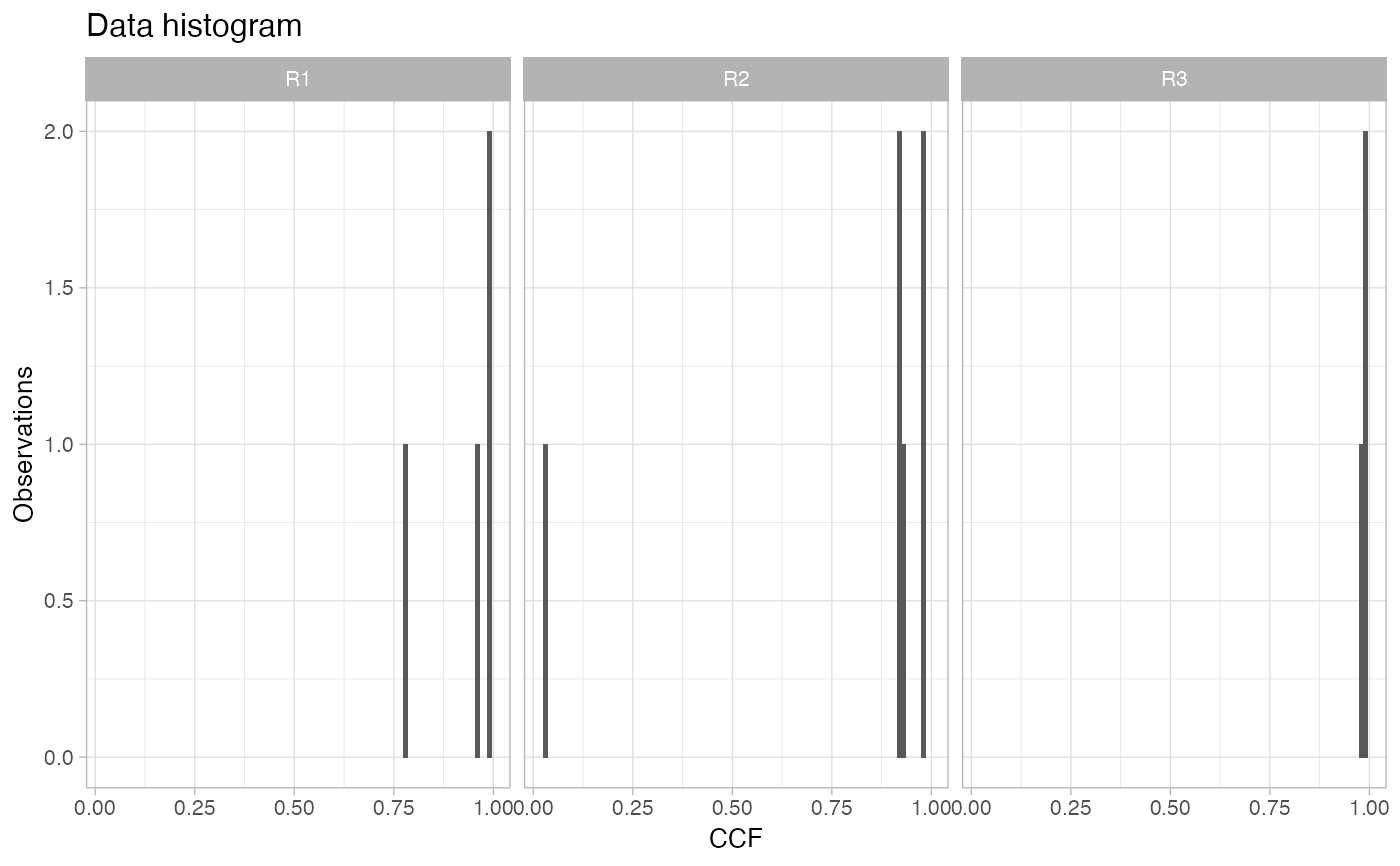
If this cohort is working with CCF data, this function plots the CCF histogram of each one of the samples available for a patient, facetting the sample variable.
Otherwise, this plot does not make much sense.
plot_patient_CCF_histogram(x, patient)Value
A ggplot plot.
See also
Other Plotting functions:
distinct_palette_few(),
distinct_palette_many(),
gradient_palette(),
plot_DET_index(),
plot_clusters(),
plot_dendrogram(),
plot_drivers_clonality(),
plot_drivers_graph(),
plot_drivers_occurrence(),
plot_jackknife_cluster_stability(),
plot_jackknife_coclustering(),
plot_jackknife_trajectories_stability(),
plot_patient_data(),
plot_patient_mutation_burden(),
plot_patient_oncoprint(),
plot_patient_trees_scores()
Examples
# Data released in the 'evoverse.datasets'
data('TRACERx_NEJM_2017_REVOLVER', package = 'evoverse.datasets')
plot_patient_CCF_histogram(TRACERx_NEJM_2017_REVOLVER, 'CRUK0001')
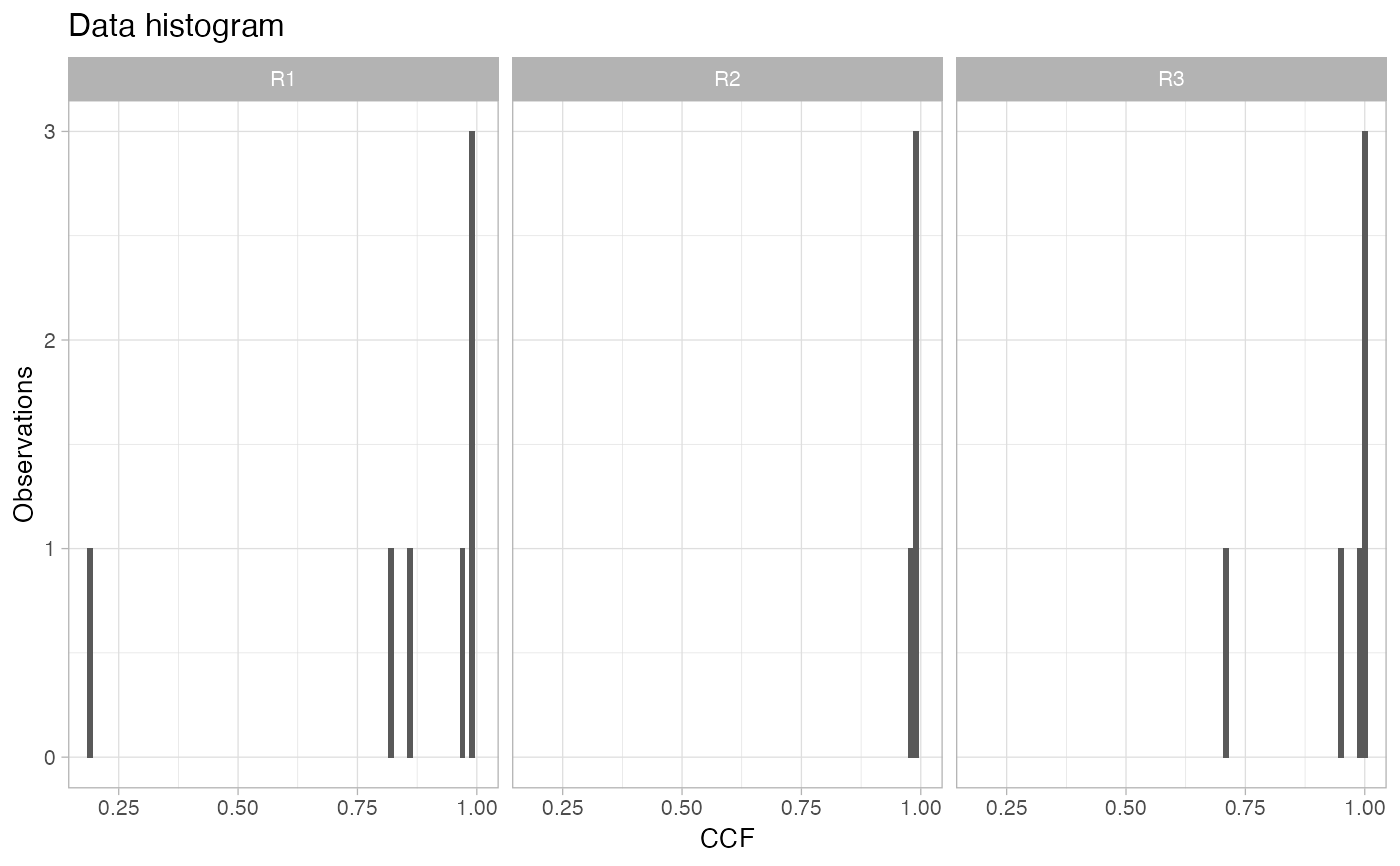 plot_patient_CCF_histogram(TRACERx_NEJM_2017_REVOLVER, 'CRUK0002')