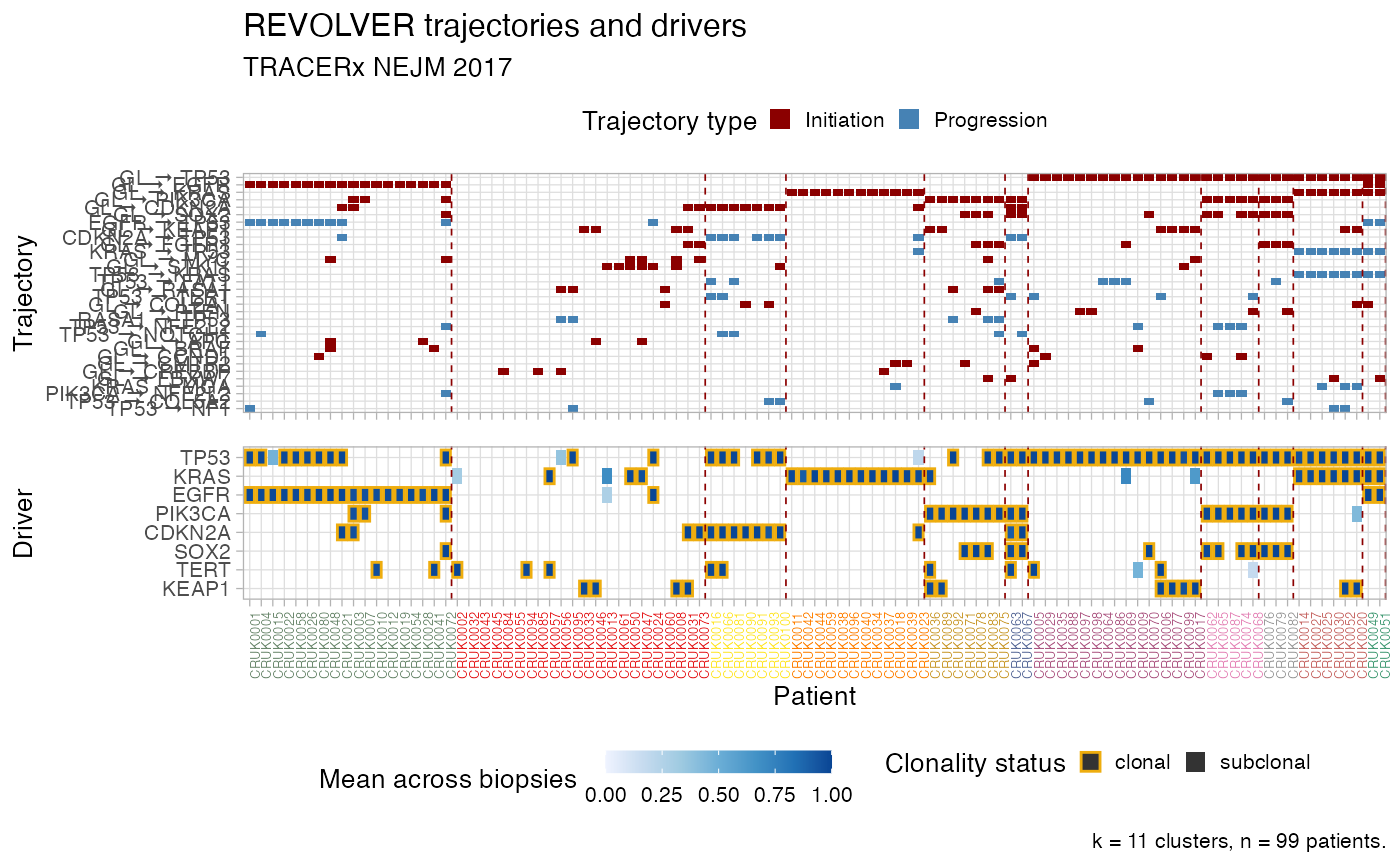
Plot the heatmaps of REVOLVER"s clusters, as tiles.
The top tile is patients vs trajectories, and bottom is patients vs drivers. For drivers colours reflect mean CCF/ binary values of a driver in every patient, and clonality status. For trajectories colours reflect if they are initiating or progressing, depending on the present of GL in the trajectory.
Patients are sorted by cluster to match the dendrogram that one can obtain with plot_dendrogram.
plot_clusters(
  x,
  cluster_palette = distinct_palette_few,
  cutoff_drivers = 5,
  cutoff_trajectories = 4,
  arrow.symbol = " → "
)
Arguments
- x
A
REVOLVERobject with fits and clusters.- cluster_palette
A palette function that should return the colour of an arbitrary number of clusters.
- cutoff_drivers
Plot only drivers that occur in at least
cutoff_driverspatients.- cutoff_trajectories
Plot only trajectories that occur in at least
cutoff_trajectoriespatients.- arrow.symbol
UNICODE code to display arrows. Saving to PDF outputs with standard methods (ggsave, cairo, etc), often can lead to errors with UNICODE chars; therefore either print to PNG or change this variable to, e.g.,
" --> "to render arrows properly.
Value
A ggplot plot.
See also
Other Plotting functions:
distinct_palette_few(),
distinct_palette_many(),
gradient_palette(),
plot_DET_index(),
plot_dendrogram(),
plot_drivers_clonality(),
plot_drivers_graph(),
plot_drivers_occurrence(),
plot_jackknife_cluster_stability(),
plot_jackknife_coclustering(),
plot_jackknife_trajectories_stability(),
plot_patient_CCF_histogram(),
plot_patient_data(),
plot_patient_mutation_burden(),
plot_patient_oncoprint(),
plot_patient_trees_scores()
Examples
# Data released in the 'evoverse.datasets'
data('TRACERx_NEJM_2017_REVOLVER', package = 'evoverse.datasets')
plot_clusters(TRACERx_NEJM_2017_REVOLVER)
#> Warning: number of columns of result, 45, is not a multiple of vector length 80 of arg 2
#> Warning: number of columns of result, 45, is not a multiple of vector length 80 of arg 2
#> Warning: number of columns of result, 45, is not a multiple of vector length 80 of arg 2
#> Warning: number of columns of result, 45, is not a multiple of vector length 80 of arg 2
#> Warning: number of columns of result, 45, is not a multiple of vector length 80 of arg 2
#> Warning: number of columns of result, 45, is not a multiple of vector length 80 of arg 2
#> Warning: number of columns of result, 45, is not a multiple of vector length 80 of arg 2
#> Warning: number of columns of result, 45, is not a multiple of vector length 80 of arg 2
#> Warning: number of columns of result, 45, is not a multiple of vector length 80 of arg 2
#> Warning: number of columns of result, 45, is not a multiple of vector length 80 of arg 2
#> Warning: number of columns of result, 45, is not a multiple of vector length 80 of arg 2
#> Warning: number of columns of result, 45, is not a multiple of vector length 80 of arg 2
#> Warning: number of columns of result, 45, is not a multiple of vector length 80 of arg 2
#> Warning: number of columns of result, 45, is not a multiple of vector length 80 of arg 2
#> Warning: number of columns of result, 45, is not a multiple of vector length 80 of arg 2
#> Warning: number of columns of result, 45, is not a multiple of vector length 80 of arg 2
#> Warning: number of columns of result, 45, is not a multiple of vector length 80 of arg 2
#> Warning: number of columns of result, 45, is not a multiple of vector length 80 of arg 2
#> Warning: number of columns of result, 45, is not a multiple of vector length 80 of arg 2
#> Warning: number of columns of result, 45, is not a multiple of vector length 80 of arg 2
#> Warning: number of columns of result, 45, is not a multiple of vector length 80 of arg 2
#> Warning: number of columns of result, 45, is not a multiple of vector length 80 of arg 2
#> Warning: number of columns of result, 45, is not a multiple of vector length 80 of arg 2
#> Warning: number of columns of result, 45, is not a multiple of vector length 80 of arg 2
#> Warning: number of columns of result, 45, is not a multiple of vector length 80 of arg 2
#> Warning: number of columns of result, 45, is not a multiple of vector length 80 of arg 2
#> Warning: number of columns of result, 45, is not a multiple of vector length 80 of arg 2
#> Warning: number of columns of result, 45, is not a multiple of vector length 80 of arg 2
#> Warning: number of columns of result, 45, is not a multiple of vector length 80 of arg 2
#> Warning: number of columns of result, 45, is not a multiple of vector length 80 of arg 2
#> Warning: number of columns of result, 45, is not a multiple of vector length 80 of arg 2
#> Warning: number of columns of result, 45, is not a multiple of vector length 80 of arg 2
#> Warning: number of columns of result, 45, is not a multiple of vector length 80 of arg 2
#> Warning: number of columns of result, 45, is not a multiple of vector length 80 of arg 2
#> Warning: number of columns of result, 45, is not a multiple of vector length 80 of arg 2
#> Warning: number of columns of result, 45, is not a multiple of vector length 80 of arg 2
#> Warning: number of columns of result, 45, is not a multiple of vector length 80 of arg 2
#> Warning: number of columns of result, 45, is not a multiple of vector length 80 of arg 2
#> Warning: number of columns of result, 45, is not a multiple of vector length 80 of arg 2
#> Warning: number of columns of result, 45, is not a multiple of vector length 80 of arg 2
#> Warning: number of columns of result, 45, is not a multiple of vector length 80 of arg 2
#> Warning: number of columns of result, 45, is not a multiple of vector length 80 of arg 2
#> Warning: number of columns of result, 45, is not a multiple of vector length 80 of arg 2
#> Warning: number of columns of result, 45, is not a multiple of vector length 80 of arg 2
#> Warning: number of columns of result, 45, is not a multiple of vector length 80 of arg 2
#> Warning: number of columns of result, 45, is not a multiple of vector length 80 of arg 2
#> Warning: number of columns of result, 45, is not a multiple of vector length 80 of arg 2
#> Warning: number of columns of result, 45, is not a multiple of vector length 80 of arg 2
#> Warning: number of columns of result, 45, is not a multiple of vector length 80 of arg 2
#> Warning: number of columns of result, 45, is not a multiple of vector length 80 of arg 2
#> Warning: number of columns of result, 45, is not a multiple of vector length 80 of arg 2
#> Warning: number of columns of result, 45, is not a multiple of vector length 80 of arg 2
#> Warning: number of columns of result, 45, is not a multiple of vector length 80 of arg 2
#> Warning: number of columns of result, 45, is not a multiple of vector length 80 of arg 2
#> Warning: No shared levels found between `names(values)` of the manual scale and the
#> data's colour values.
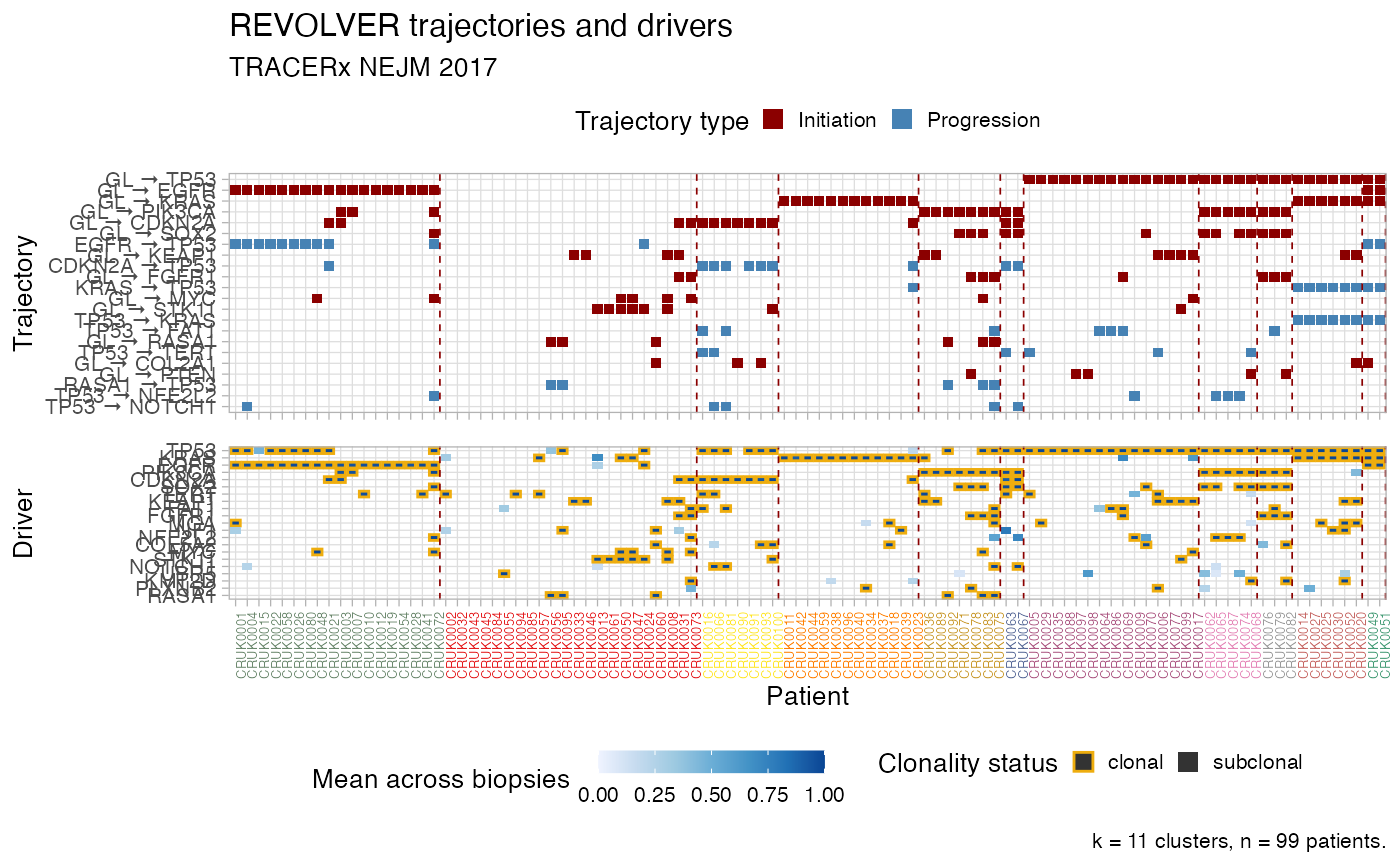 plot_clusters(TRACERx_NEJM_2017_REVOLVER, cutoff_drivers = 10, cutoff_trajectories = 3)
#> Warning: number of columns of result, 45, is not a multiple of vector length 80 of arg 2
#> Warning: number of columns of result, 45, is not a multiple of vector length 80 of arg 2
#> Warning: number of columns of result, 45, is not a multiple of vector length 80 of arg 2
#> Warning: number of columns of result, 45, is not a multiple of vector length 80 of arg 2
#> Warning: number of columns of result, 45, is not a multiple of vector length 80 of arg 2
#> Warning: number of columns of result, 45, is not a multiple of vector length 80 of arg 2
#> Warning: number of columns of result, 45, is not a multiple of vector length 80 of arg 2
#> Warning: number of columns of result, 45, is not a multiple of vector length 80 of arg 2
#> Warning: number of columns of result, 45, is not a multiple of vector length 80 of arg 2
#> Warning: number of columns of result, 45, is not a multiple of vector length 80 of arg 2
#> Warning: number of columns of result, 45, is not a multiple of vector length 80 of arg 2
#> Warning: number of columns of result, 45, is not a multiple of vector length 80 of arg 2
#> Warning: number of columns of result, 45, is not a multiple of vector length 80 of arg 2
#> Warning: number of columns of result, 45, is not a multiple of vector length 80 of arg 2
#> Warning: number of columns of result, 45, is not a multiple of vector length 80 of arg 2
#> Warning: number of columns of result, 45, is not a multiple of vector length 80 of arg 2
#> Warning: number of columns of result, 45, is not a multiple of vector length 80 of arg 2
#> Warning: number of columns of result, 45, is not a multiple of vector length 80 of arg 2
#> Warning: number of columns of result, 45, is not a multiple of vector length 80 of arg 2
#> Warning: number of columns of result, 45, is not a multiple of vector length 80 of arg 2
#> Warning: number of columns of result, 45, is not a multiple of vector length 80 of arg 2
#> Warning: number of columns of result, 45, is not a multiple of vector length 80 of arg 2
#> Warning: number of columns of result, 45, is not a multiple of vector length 80 of arg 2
#> Warning: number of columns of result, 45, is not a multiple of vector length 80 of arg 2
#> Warning: number of columns of result, 45, is not a multiple of vector length 80 of arg 2
#> Warning: number of columns of result, 45, is not a multiple of vector length 80 of arg 2
#> Warning: number of columns of result, 45, is not a multiple of vector length 80 of arg 2
#> Warning: number of columns of result, 45, is not a multiple of vector length 80 of arg 2
#> Warning: number of columns of result, 45, is not a multiple of vector length 80 of arg 2
#> Warning: number of columns of result, 45, is not a multiple of vector length 80 of arg 2
#> Warning: number of columns of result, 45, is not a multiple of vector length 80 of arg 2
#> Warning: number of columns of result, 45, is not a multiple of vector length 80 of arg 2
#> Warning: number of columns of result, 45, is not a multiple of vector length 80 of arg 2
#> Warning: number of columns of result, 45, is not a multiple of vector length 80 of arg 2
#> Warning: number of columns of result, 45, is not a multiple of vector length 80 of arg 2
#> Warning: number of columns of result, 45, is not a multiple of vector length 80 of arg 2
#> Warning: number of columns of result, 45, is not a multiple of vector length 80 of arg 2
#> Warning: number of columns of result, 45, is not a multiple of vector length 80 of arg 2
#> Warning: number of columns of result, 45, is not a multiple of vector length 80 of arg 2
#> Warning: number of columns of result, 45, is not a multiple of vector length 80 of arg 2
#> Warning: number of columns of result, 45, is not a multiple of vector length 80 of arg 2
#> Warning: number of columns of result, 45, is not a multiple of vector length 80 of arg 2
#> Warning: number of columns of result, 45, is not a multiple of vector length 80 of arg 2
#> Warning: number of columns of result, 45, is not a multiple of vector length 80 of arg 2
#> Warning: number of columns of result, 45, is not a multiple of vector length 80 of arg 2
#> Warning: number of columns of result, 45, is not a multiple of vector length 80 of arg 2
#> Warning: number of columns of result, 45, is not a multiple of vector length 80 of arg 2
#> Warning: number of columns of result, 45, is not a multiple of vector length 80 of arg 2
#> Warning: number of columns of result, 45, is not a multiple of vector length 80 of arg 2
#> Warning: number of columns of result, 45, is not a multiple of vector length 80 of arg 2
#> Warning: number of columns of result, 45, is not a multiple of vector length 80 of arg 2
#> Warning: number of columns of result, 45, is not a multiple of vector length 80 of arg 2
#> Warning: number of columns of result, 45, is not a multiple of vector length 80 of arg 2
#> Warning: number of columns of result, 45, is not a multiple of vector length 80 of arg 2
#> Warning: No shared levels found between `names(values)` of the manual scale and the
#> data's colour values.
plot_clusters(TRACERx_NEJM_2017_REVOLVER, cutoff_drivers = 10, cutoff_trajectories = 3)
#> Warning: number of columns of result, 45, is not a multiple of vector length 80 of arg 2
#> Warning: number of columns of result, 45, is not a multiple of vector length 80 of arg 2
#> Warning: number of columns of result, 45, is not a multiple of vector length 80 of arg 2
#> Warning: number of columns of result, 45, is not a multiple of vector length 80 of arg 2
#> Warning: number of columns of result, 45, is not a multiple of vector length 80 of arg 2
#> Warning: number of columns of result, 45, is not a multiple of vector length 80 of arg 2
#> Warning: number of columns of result, 45, is not a multiple of vector length 80 of arg 2
#> Warning: number of columns of result, 45, is not a multiple of vector length 80 of arg 2
#> Warning: number of columns of result, 45, is not a multiple of vector length 80 of arg 2
#> Warning: number of columns of result, 45, is not a multiple of vector length 80 of arg 2
#> Warning: number of columns of result, 45, is not a multiple of vector length 80 of arg 2
#> Warning: number of columns of result, 45, is not a multiple of vector length 80 of arg 2
#> Warning: number of columns of result, 45, is not a multiple of vector length 80 of arg 2
#> Warning: number of columns of result, 45, is not a multiple of vector length 80 of arg 2
#> Warning: number of columns of result, 45, is not a multiple of vector length 80 of arg 2
#> Warning: number of columns of result, 45, is not a multiple of vector length 80 of arg 2
#> Warning: number of columns of result, 45, is not a multiple of vector length 80 of arg 2
#> Warning: number of columns of result, 45, is not a multiple of vector length 80 of arg 2
#> Warning: number of columns of result, 45, is not a multiple of vector length 80 of arg 2
#> Warning: number of columns of result, 45, is not a multiple of vector length 80 of arg 2
#> Warning: number of columns of result, 45, is not a multiple of vector length 80 of arg 2
#> Warning: number of columns of result, 45, is not a multiple of vector length 80 of arg 2
#> Warning: number of columns of result, 45, is not a multiple of vector length 80 of arg 2
#> Warning: number of columns of result, 45, is not a multiple of vector length 80 of arg 2
#> Warning: number of columns of result, 45, is not a multiple of vector length 80 of arg 2
#> Warning: number of columns of result, 45, is not a multiple of vector length 80 of arg 2
#> Warning: number of columns of result, 45, is not a multiple of vector length 80 of arg 2
#> Warning: number of columns of result, 45, is not a multiple of vector length 80 of arg 2
#> Warning: number of columns of result, 45, is not a multiple of vector length 80 of arg 2
#> Warning: number of columns of result, 45, is not a multiple of vector length 80 of arg 2
#> Warning: number of columns of result, 45, is not a multiple of vector length 80 of arg 2
#> Warning: number of columns of result, 45, is not a multiple of vector length 80 of arg 2
#> Warning: number of columns of result, 45, is not a multiple of vector length 80 of arg 2
#> Warning: number of columns of result, 45, is not a multiple of vector length 80 of arg 2
#> Warning: number of columns of result, 45, is not a multiple of vector length 80 of arg 2
#> Warning: number of columns of result, 45, is not a multiple of vector length 80 of arg 2
#> Warning: number of columns of result, 45, is not a multiple of vector length 80 of arg 2
#> Warning: number of columns of result, 45, is not a multiple of vector length 80 of arg 2
#> Warning: number of columns of result, 45, is not a multiple of vector length 80 of arg 2
#> Warning: number of columns of result, 45, is not a multiple of vector length 80 of arg 2
#> Warning: number of columns of result, 45, is not a multiple of vector length 80 of arg 2
#> Warning: number of columns of result, 45, is not a multiple of vector length 80 of arg 2
#> Warning: number of columns of result, 45, is not a multiple of vector length 80 of arg 2
#> Warning: number of columns of result, 45, is not a multiple of vector length 80 of arg 2
#> Warning: number of columns of result, 45, is not a multiple of vector length 80 of arg 2
#> Warning: number of columns of result, 45, is not a multiple of vector length 80 of arg 2
#> Warning: number of columns of result, 45, is not a multiple of vector length 80 of arg 2
#> Warning: number of columns of result, 45, is not a multiple of vector length 80 of arg 2
#> Warning: number of columns of result, 45, is not a multiple of vector length 80 of arg 2
#> Warning: number of columns of result, 45, is not a multiple of vector length 80 of arg 2
#> Warning: number of columns of result, 45, is not a multiple of vector length 80 of arg 2
#> Warning: number of columns of result, 45, is not a multiple of vector length 80 of arg 2
#> Warning: number of columns of result, 45, is not a multiple of vector length 80 of arg 2
#> Warning: number of columns of result, 45, is not a multiple of vector length 80 of arg 2
#> Warning: No shared levels found between `names(values)` of the manual scale and the
#> data's colour values.