Plot the scores for a patient's trees.
Source:R/plot_patient_trees_scores.R
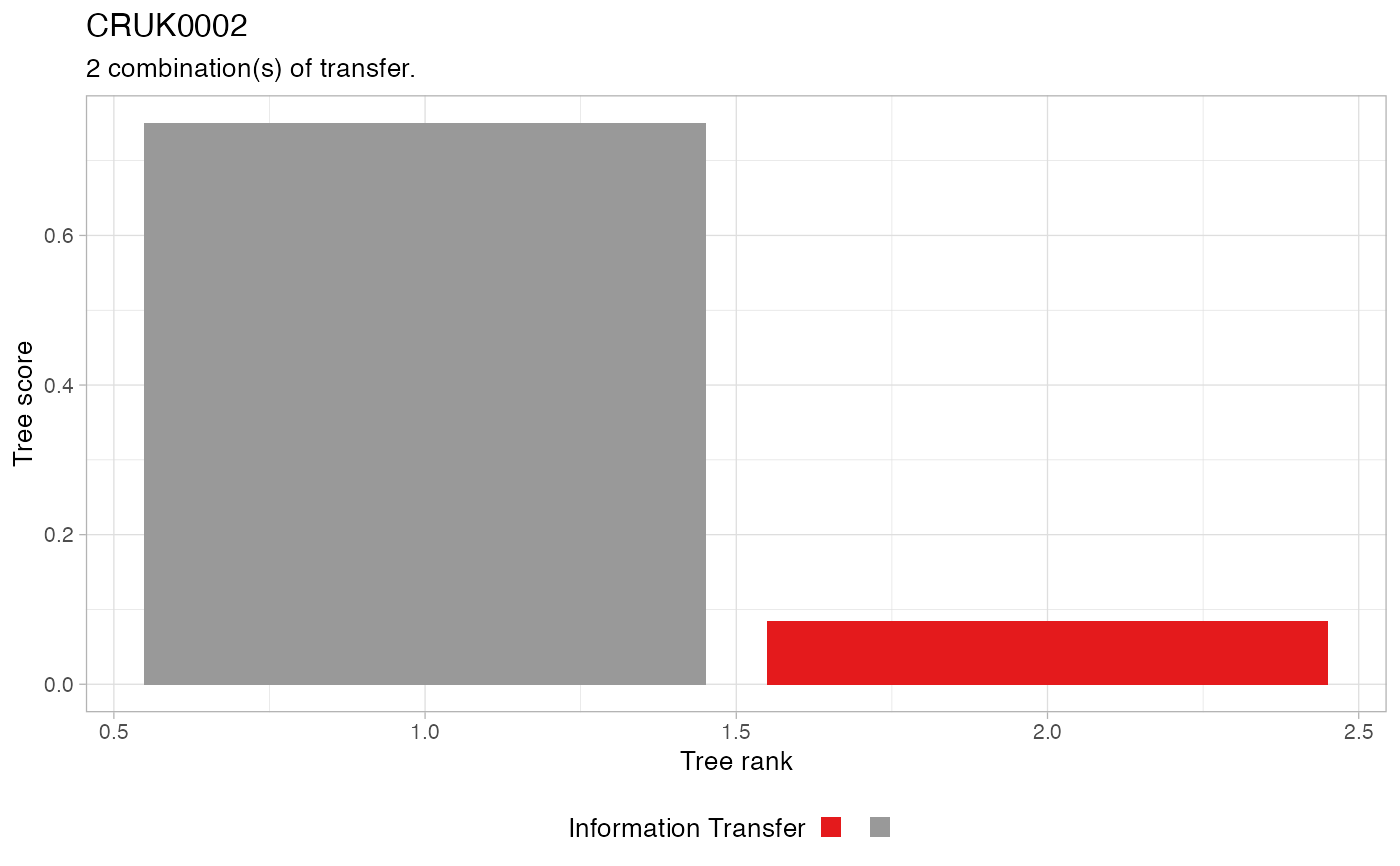
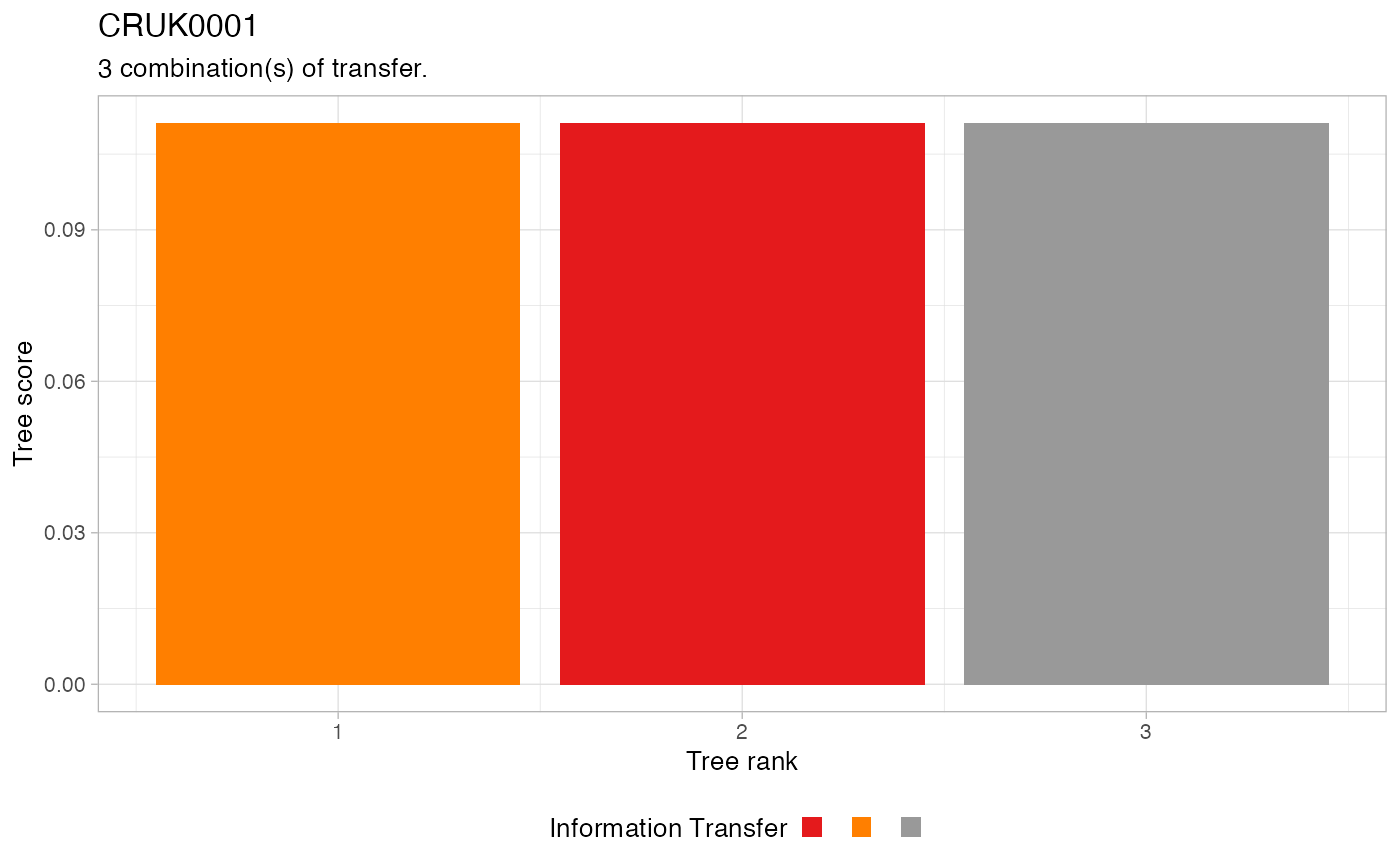
plot_patient_trees_scores.RdPlots a barplot where each tree is a bar, with height proportional to the tree score and colour to its particular combination of transfer.
plot_patient_trees_scores(
  x,
  patient,
  transfer_palette = distinct_palette_few,
  ...
)
Arguments
Value
A ggplot plot.
See also
Other Plotting functions:
distinct_palette_few(),
distinct_palette_many(),
gradient_palette(),
plot_DET_index(),
plot_clusters(),
plot_dendrogram(),
plot_drivers_clonality(),
plot_drivers_graph(),
plot_drivers_occurrence(),
plot_jackknife_cluster_stability(),
plot_jackknife_coclustering(),
plot_jackknife_trajectories_stability(),
plot_patient_CCF_histogram(),
plot_patient_data(),
plot_patient_mutation_burden(),
plot_patient_oncoprint()
Examples
# Data released in the 'evoverse.datasets'
data('TRACERx_NEJM_2017_REVOLVER', package = 'evoverse.datasets')

plot_patient_trees_scores(TRACERx_NEJM_2017_REVOLVER, 'CRUK0001')

plot_patient_trees_scores(TRACERx_NEJM_2017_REVOLVER, 'CRUK0002')