Plot the clonality status of cohort driver events.
Source:R/plot_drivers_clonality.R
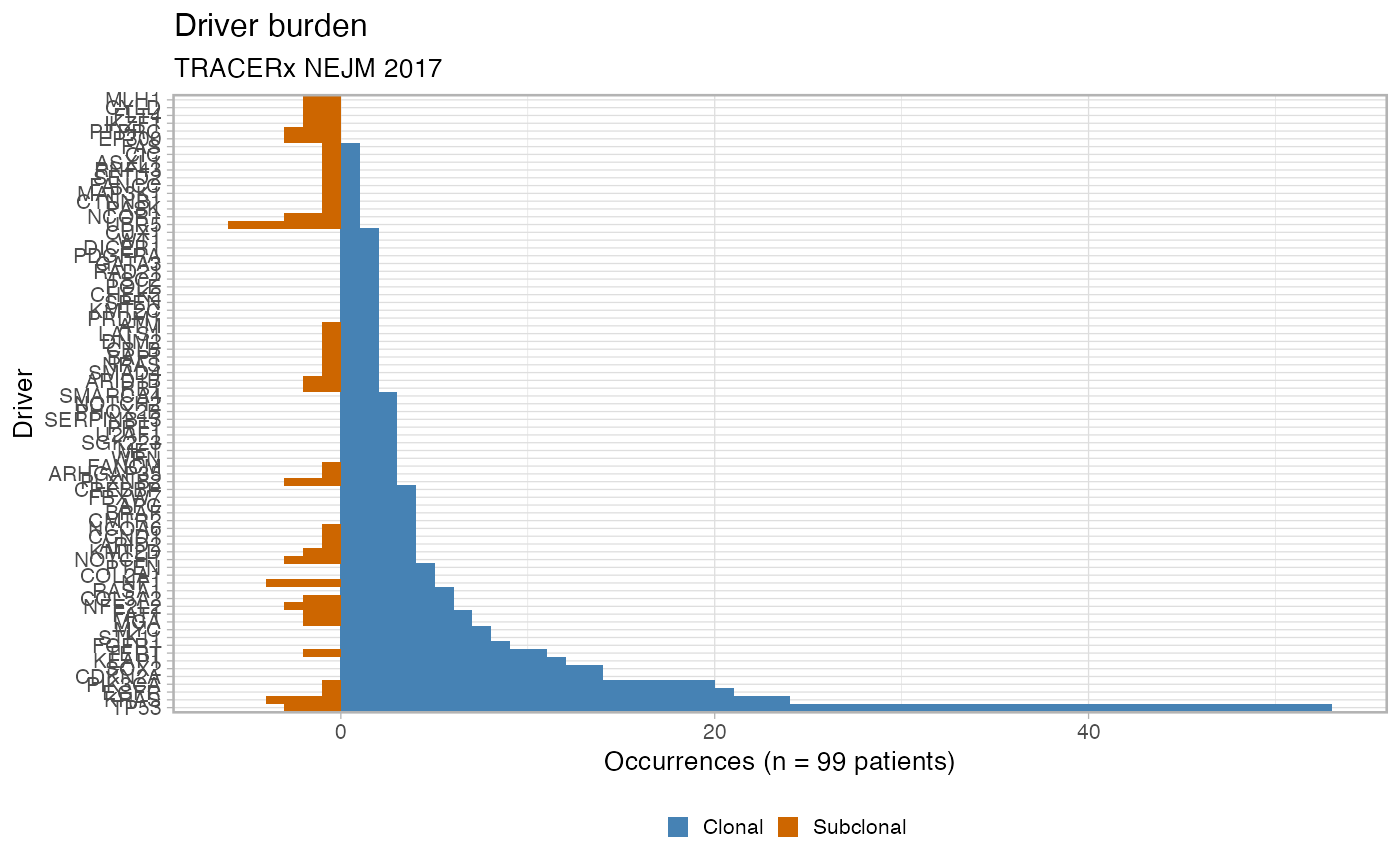
plot_drivers_clonality.RdDriver events can be annotated in clonal or subclonal clusters. This function reports this information in a barplot.
plot_drivers_clonality(x)Value
A ggplot object of the plot.
See also
Other Plotting functions:
distinct_palette_few(),
distinct_palette_many(),
gradient_palette(),
plot_DET_index(),
plot_clusters(),
plot_dendrogram(),
plot_drivers_graph(),
plot_drivers_occurrence(),
plot_jackknife_cluster_stability(),
plot_jackknife_coclustering(),
plot_jackknife_trajectories_stability(),
plot_patient_CCF_histogram(),
plot_patient_data(),
plot_patient_mutation_burden(),
plot_patient_oncoprint(),
plot_patient_trees_scores()
Examples
# Data released in the 'evoverse.datasets'
data('TRACERx_NEJM_2017_REVOLVER', package = 'evoverse.datasets')

plot_drivers_clonality(TRACERx_NEJM_2017_REVOLVER)