Plot the index of Divergent Evolutionary Trajectories, for a set of drivers
using function DET_index. The plot is a barplot with colours reflecting
the number of distinct incoming edges in each driver (species), and the height
reflecting the actual DET index value.
plot_DET_index(x, ...)Arguments
Value
A `ggplot` object of the plot.
See also
Other Plotting functions:
distinct_palette_few(),
distinct_palette_many(),
gradient_palette(),
plot_clusters(),
plot_dendrogram(),
plot_drivers_clonality(),
plot_drivers_graph(),
plot_drivers_occurrence(),
plot_jackknife_cluster_stability(),
plot_jackknife_coclustering(),
plot_jackknife_trajectories_stability(),
plot_patient_CCF_histogram(),
plot_patient_data(),
plot_patient_mutation_burden(),
plot_patient_oncoprint(),
plot_patient_trees_scores()
Examples
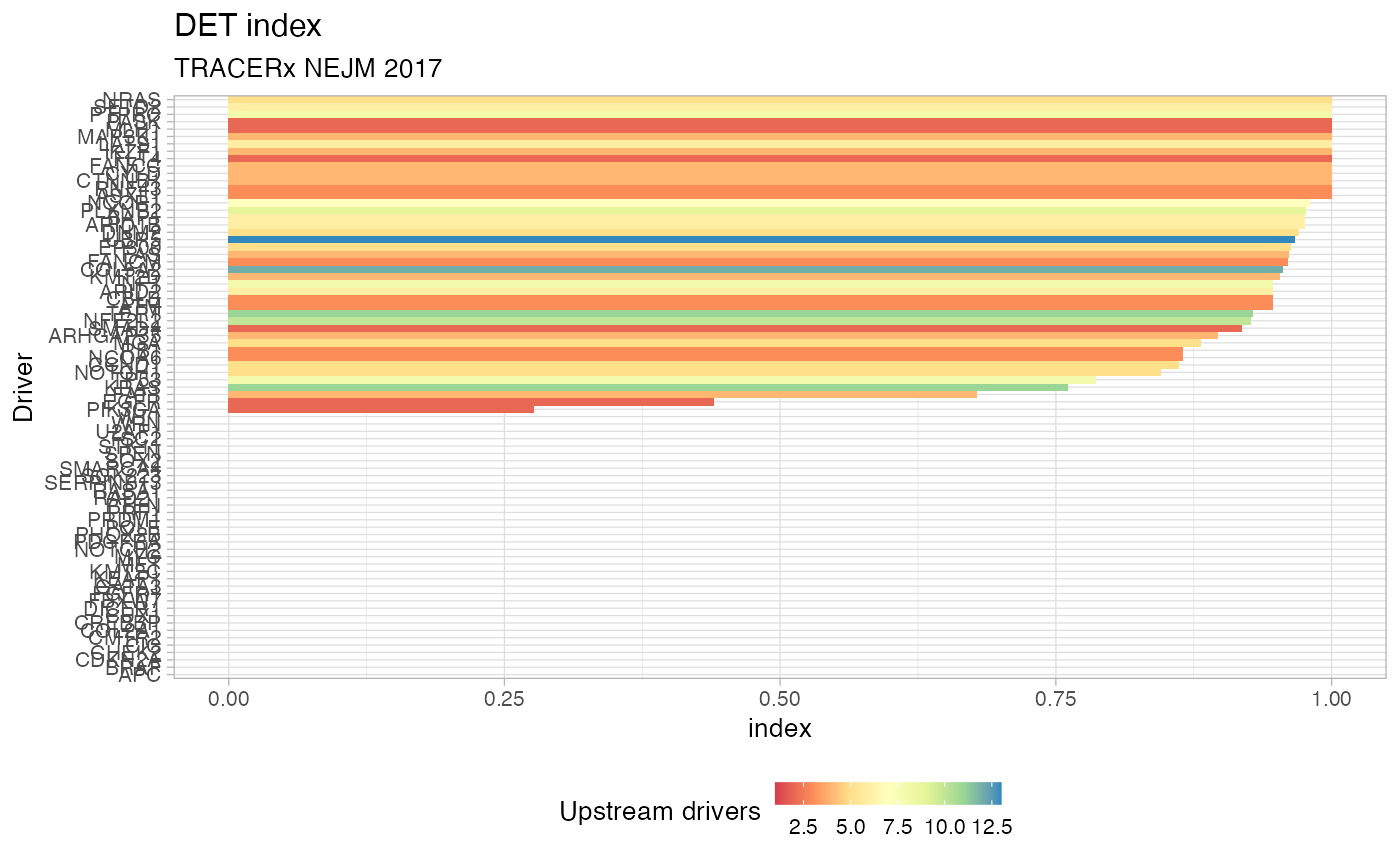
# Data released in the 'evoverse.datasets'
data('TRACERx_NEJM_2017_REVOLVER', package = 'evoverse.datasets')
plot_DET_index(TRACERx_NEJM_2017_REVOLVER)
#> # A tibble: 79 × 4
#> driver diversity N DET_index
#> <chr> <dbl> <int> <dbl>
#> 1 APC 0 1 0
#> 2 BRAF 0 1 0
#> 3 CDKN2A 0 1 0
#> 4 CHEK2 0 1 0
#> 5 CIC 0 1 0
#> 6 CMTR2 0 1 0
#> 7 COL2A1 0 1 0
#> 8 CREBBP 0 1 0
#> 9 CUX1 0 1 0
#> 10 DICER1 0 1 0
#> # ℹ 69 more rows
 # Passing parameters to DET_index
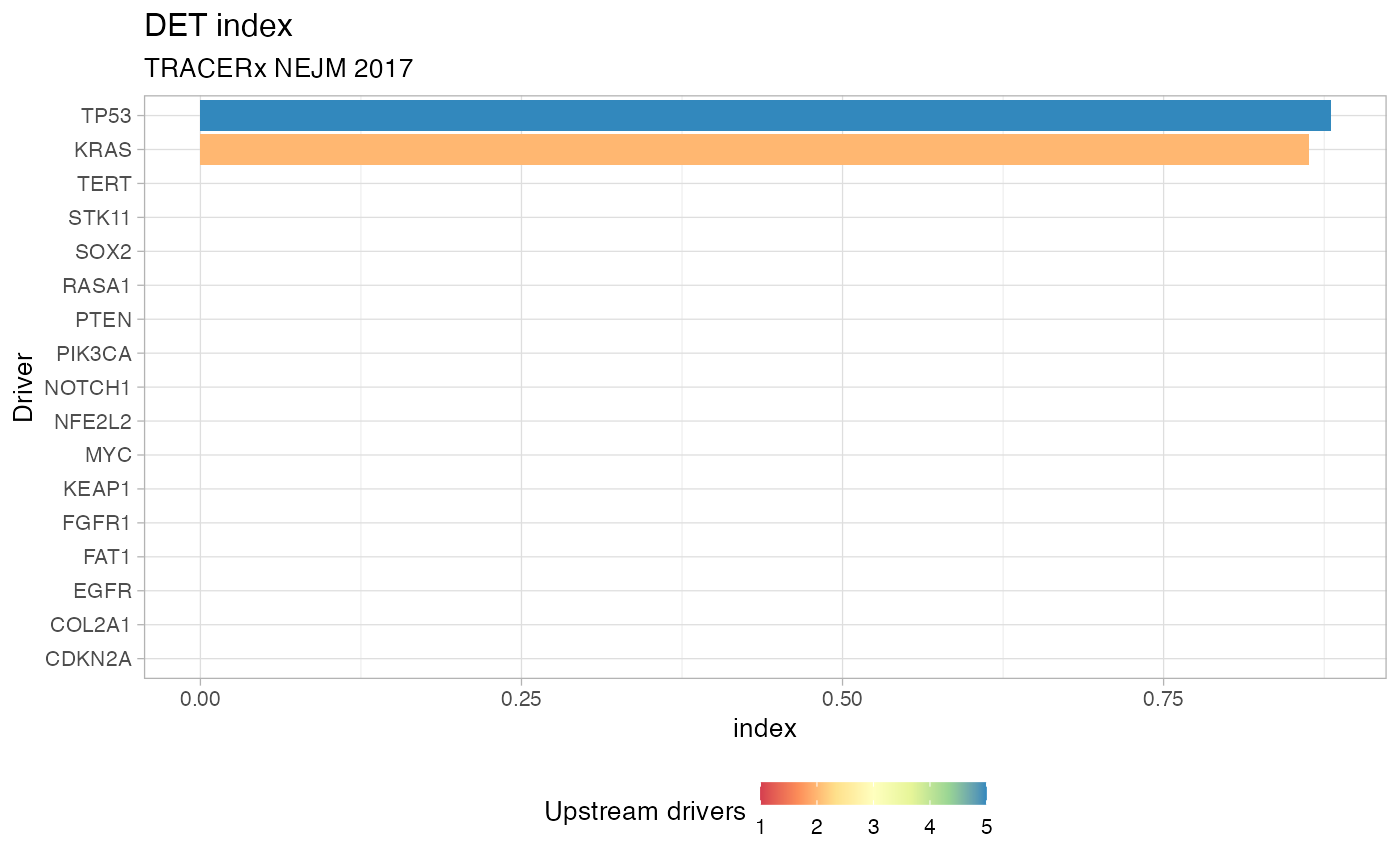
plot_DET_index(TRACERx_NEJM_2017_REVOLVER, min.occurrences = 5)
#> # A tibble: 17 × 4
#> driver diversity N DET_index
#> <chr> <dbl> <int> <dbl>
#> 1 CDKN2A 0 1 0
#> 2 COL2A1 0 1 0
#> 3 EGFR 0 1 0
#> 4 FAT1 0 1 0
#> 5 FGFR1 0 1 0
#> 6 KEAP1 0 1 0
#> 7 MYC 0 1 0
#> 8 NFE2L2 0 1 0
#> 9 NOTCH1 0 1 0
#> 10 PIK3CA 0 1 0
#> 11 PTEN 0 1 0
#> 12 RASA1 0 1 0
#> 13 SOX2 0 1 0
#> 14 STK11 0 1 0
#> 15 TERT 0 1 0
#> 16 KRAS 0.598 2 0.863
#> 17 TP53 1.42 5 0.880
# Passing parameters to DET_index
plot_DET_index(TRACERx_NEJM_2017_REVOLVER, min.occurrences = 5)
#> # A tibble: 17 × 4
#> driver diversity N DET_index
#> <chr> <dbl> <int> <dbl>
#> 1 CDKN2A 0 1 0
#> 2 COL2A1 0 1 0
#> 3 EGFR 0 1 0
#> 4 FAT1 0 1 0
#> 5 FGFR1 0 1 0
#> 6 KEAP1 0 1 0
#> 7 MYC 0 1 0
#> 8 NFE2L2 0 1 0
#> 9 NOTCH1 0 1 0
#> 10 PIK3CA 0 1 0
#> 11 PTEN 0 1 0
#> 12 RASA1 0 1 0
#> 13 SOX2 0 1 0
#> 14 STK11 0 1 0
#> 15 TERT 0 1 0
#> 16 KRAS 0.598 2 0.863
#> 17 TP53 1.42 5 0.880