Plot the mutation burden for a patient.
Source:R/plot_patient_mutation_burden.R
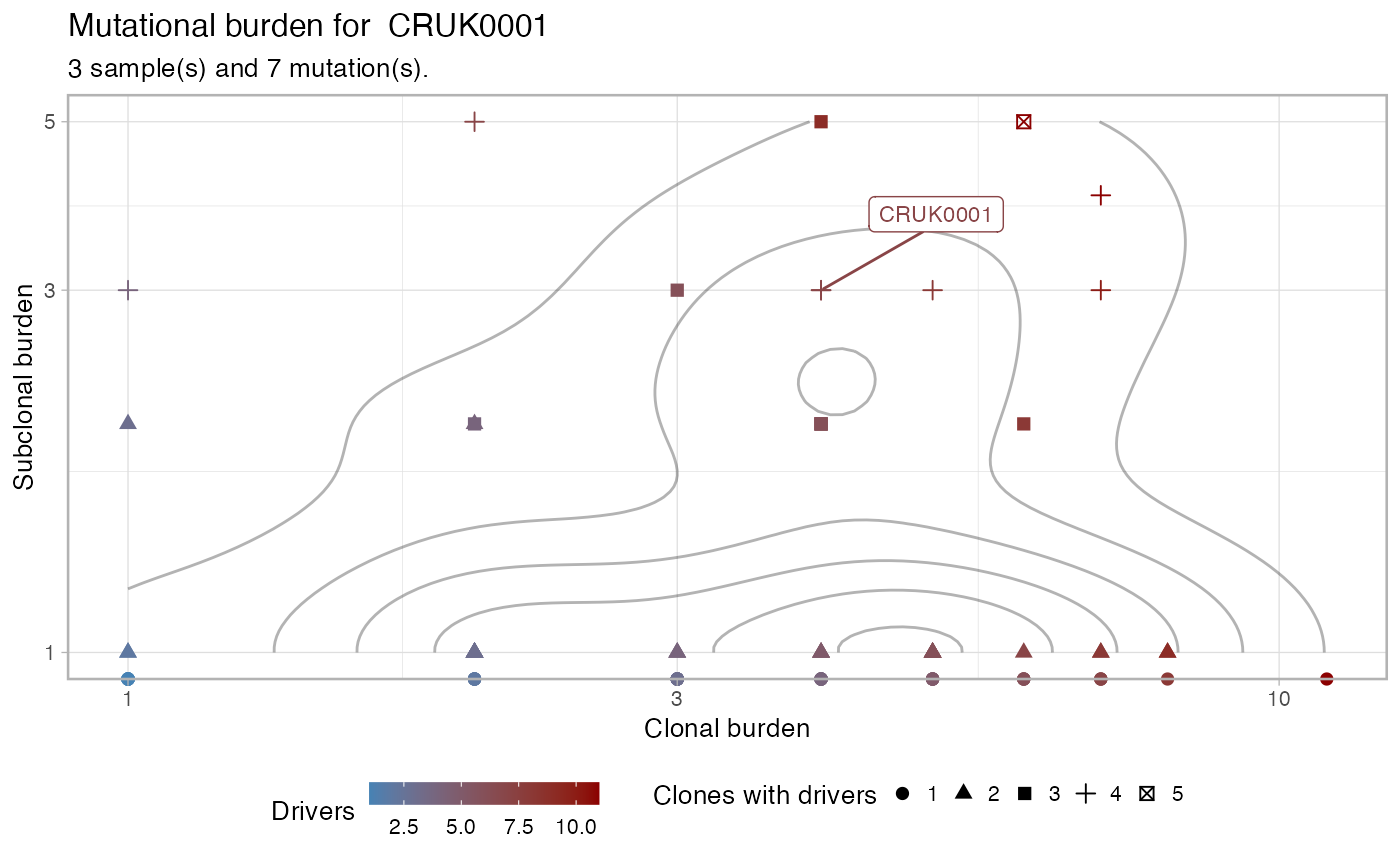
plot_patient_mutation_burden.RdThis function creates a scatterplot of a full cohort annotating clonal versus subclonal mutational burden, colouring each point by the number of total drivers in the patient, and using as shape the number of clones with drivers.
plot_patient_mutation_burden(x, patient, ...)Value
A ggplot plot.
See also
Other Plotting functions:
distinct_palette_few(),
distinct_palette_many(),
gradient_palette(),
plot_DET_index(),
plot_clusters(),
plot_dendrogram(),
plot_drivers_clonality(),
plot_drivers_graph(),
plot_drivers_occurrence(),
plot_jackknife_cluster_stability(),
plot_jackknife_coclustering(),
plot_jackknife_trajectories_stability(),
plot_patient_CCF_histogram(),
plot_patient_data(),
plot_patient_oncoprint(),
plot_patient_trees_scores()
Examples
# Data released in the 'evoverse.datasets'
data('TRACERx_NEJM_2017_REVOLVER', package = 'evoverse.datasets')

plot_patient_mutation_burden(TRACERx_NEJM_2017_REVOLVER, 'CRUK0001')
#> Warning: log-10 transformation introduced infinite values.
#> Warning: log-10 transformation introduced infinite values.
#> Warning: Removed 54 rows containing non-finite outside the scale range
#> (`stat_density2d()`).

plot_patient_mutation_burden(TRACERx_NEJM_2017_REVOLVER, 'CRUK0002')
#> Warning: log-10 transformation introduced infinite values.
#> Warning: log-10 transformation introduced infinite values.
#> Warning: Removed 54 rows containing non-finite outside the scale range
#> (`stat_density2d()`).
plot_patient_mutation_burden(TRACERx_NEJM_2017_REVOLVER, 'CRUK0002')
#> Warning: log-10 transformation introduced infinite values.
#> Warning: log-10 transformation introduced infinite values.
#> Warning: Removed 54 rows containing non-finite outside the scale range
#> (`stat_density2d()`).
