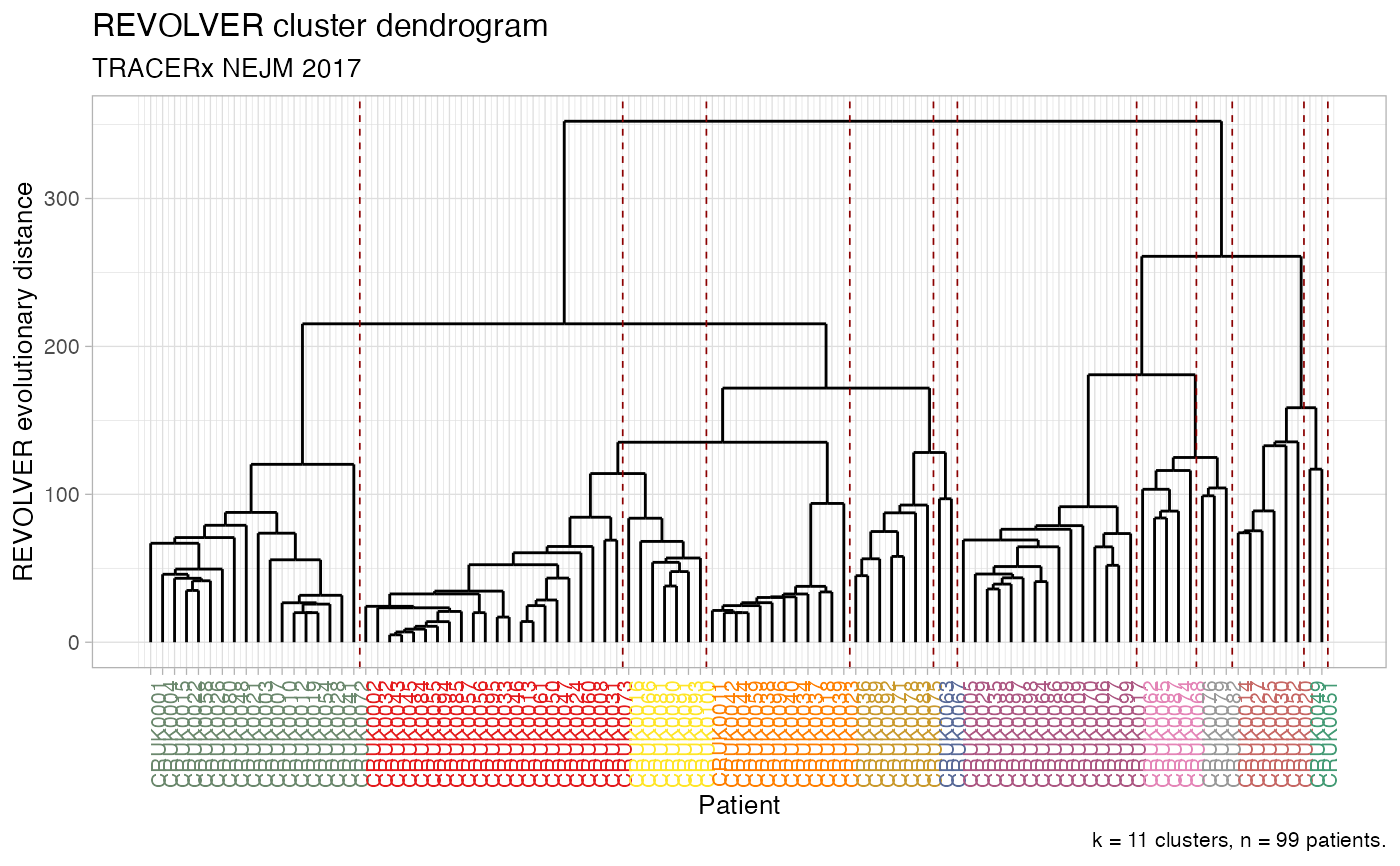
Plot the dendrogram of REVOLVER"s clusters, where leaves are patient ids, coloured by cluster.
plot_dendrogram(x, cluster_palette = distinct_palette_few)Arguments
Value
A ggplot plot.
See also
Other Plotting functions:
distinct_palette_few(),
distinct_palette_many(),
gradient_palette(),
plot_DET_index(),
plot_clusters(),
plot_drivers_clonality(),
plot_drivers_graph(),
plot_drivers_occurrence(),
plot_jackknife_cluster_stability(),
plot_jackknife_coclustering(),
plot_jackknife_trajectories_stability(),
plot_patient_CCF_histogram(),
plot_patient_data(),
plot_patient_mutation_burden(),
plot_patient_oncoprint(),
plot_patient_trees_scores()
Examples
# Data released in the 'evoverse.datasets'
data('TRACERx_NEJM_2017_REVOLVER', package = 'evoverse.datasets')

plot_dendrogram(TRACERx_NEJM_2017_REVOLVER)
#> Warning: No shared levels found between `names(values)` of the manual scale and the
#> data's colour values.