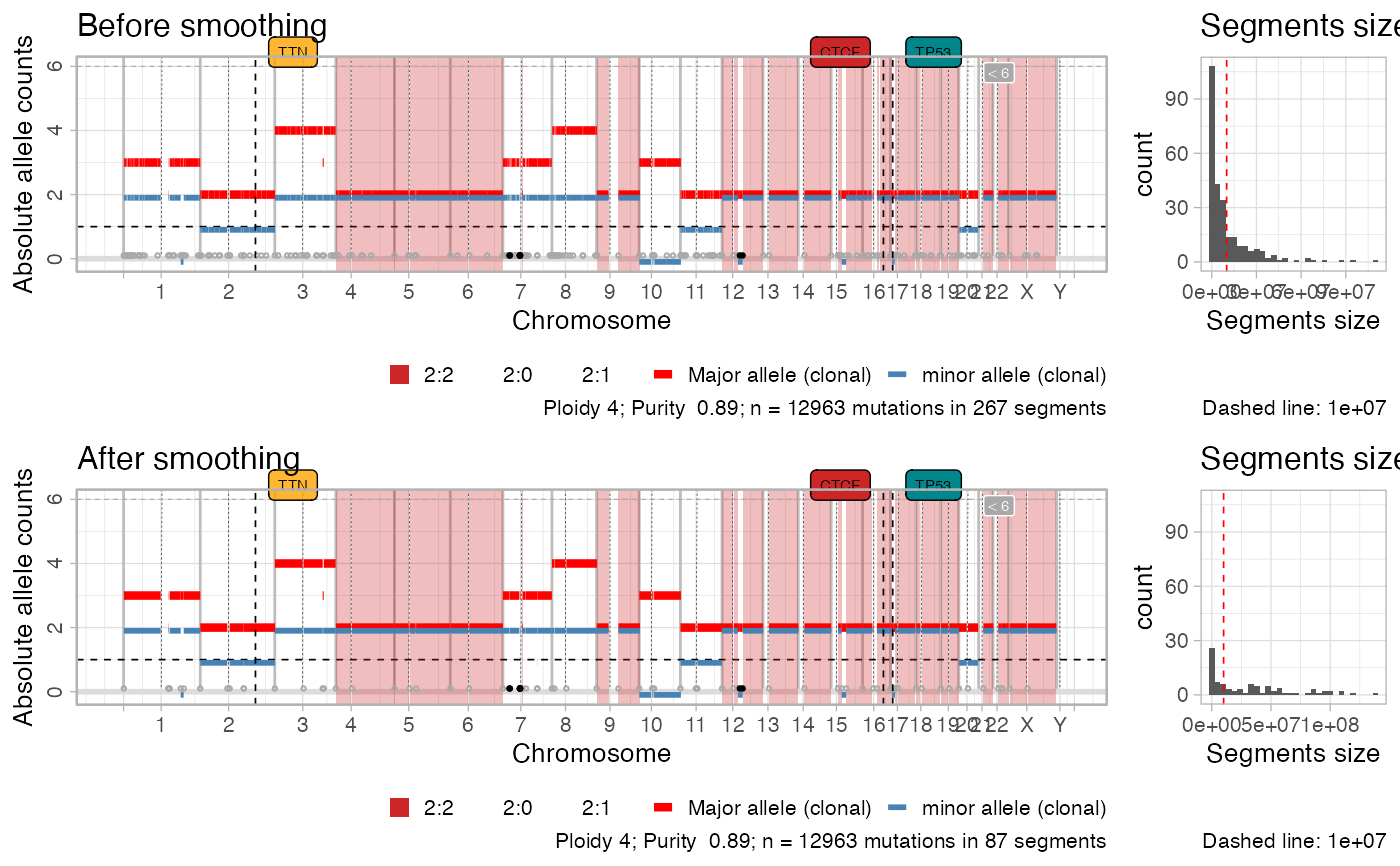
Upon using the `smooth_segments` function, this function plots a multipanel figure with the segments profile before and after smoothing.
plot_smoothing(x)Value
A ggpubr figure..
See also
smooth_segments
Examples
data('example_dataset_CNAqc', package = 'CNAqc')
x = init(mutations = example_dataset_CNAqc$mutations, cna = example_dataset_CNAqc$cna, purity = example_dataset_CNAqc$purity)
#>
#> ── CNAqc - CNA Quality Check ───────────────────────────────────────────────────
#>
#> ℹ Using reference genome coordinates for: GRCh38.
#> ✔ Found annotated driver mutations: TTN, CTCF, and TP53.
#> ✔ Fortified calls for 12963 somatic mutations: 12963 SNVs (100%) and 0 indels.
#> ! CNAs have no CCF, assuming clonal CNAs (CCF = 1).
#> ✔ Fortified CNAs for 267 segments: 267 clonal and 0 subclonal.
#> ✔ 12963 mutations mapped to clonal CNAs.

# Smooth
x = smooth_segments(x)
#> → chr1 37 -6 @
#> → chr10 8 -3 @
#> → chr11 22 -3 @
#> → chr12 13 -11 @
#> → chr14 2 -1 @
#> → chr15 9 -3 @
#> → chr16 10 -3 @
#> → chr17 10 -6 @
#> → chr18 8 -2 @
#> → chr19 5 -2 @
#> → chr2 18 -5 @
#> → chr20 9 -2 @
#> → chr21 2 -1 @
#> → chr22 3 -3 @
#> → chr3 19 -4 @
#> → chr4 8 -2 @
#> → chr5 6 -3 @
#> → chr6 4 -2 @
#> → chr7 46 -17 @
#> → chr8 18 -3 @
#> → chr9 3 -2 @
#> → chrX 6 -2 @
#>
#> ✔ Smoothed from 267 to 87 segments with 1e+06 gap (bases).
#> ℹ Creating a new CNAqc object. The old object will be retained in the $before_smoothing field.
#>
#> ── CNAqc - CNA Quality Check ───────────────────────────────────────────────────
#>
#> ℹ Using reference genome coordinates for: GRCh38.
#> ✔ Found annotated driver mutations: TTN, CTCF, and TP53.
#> ✔ Fortified calls for 12963 somatic mutations: 12963 SNVs (100%) and 0 indels.
#> ✔ Fortified CNAs for 87 segments: 87 clonal and 0 subclonal.
#> Warning: [CNAqc] a karyotype column is present in CNA calls, and will be overwritten
#> ✔ 12963 mutations mapped to clonal CNAs.

# View differences
plot_smoothing(x)
#> Scale for fill is already present.
#> Adding another scale for fill, which will replace the existing scale.
#> Scale for fill is already present.
#> Adding another scale for fill, which will replace the existing scale.
