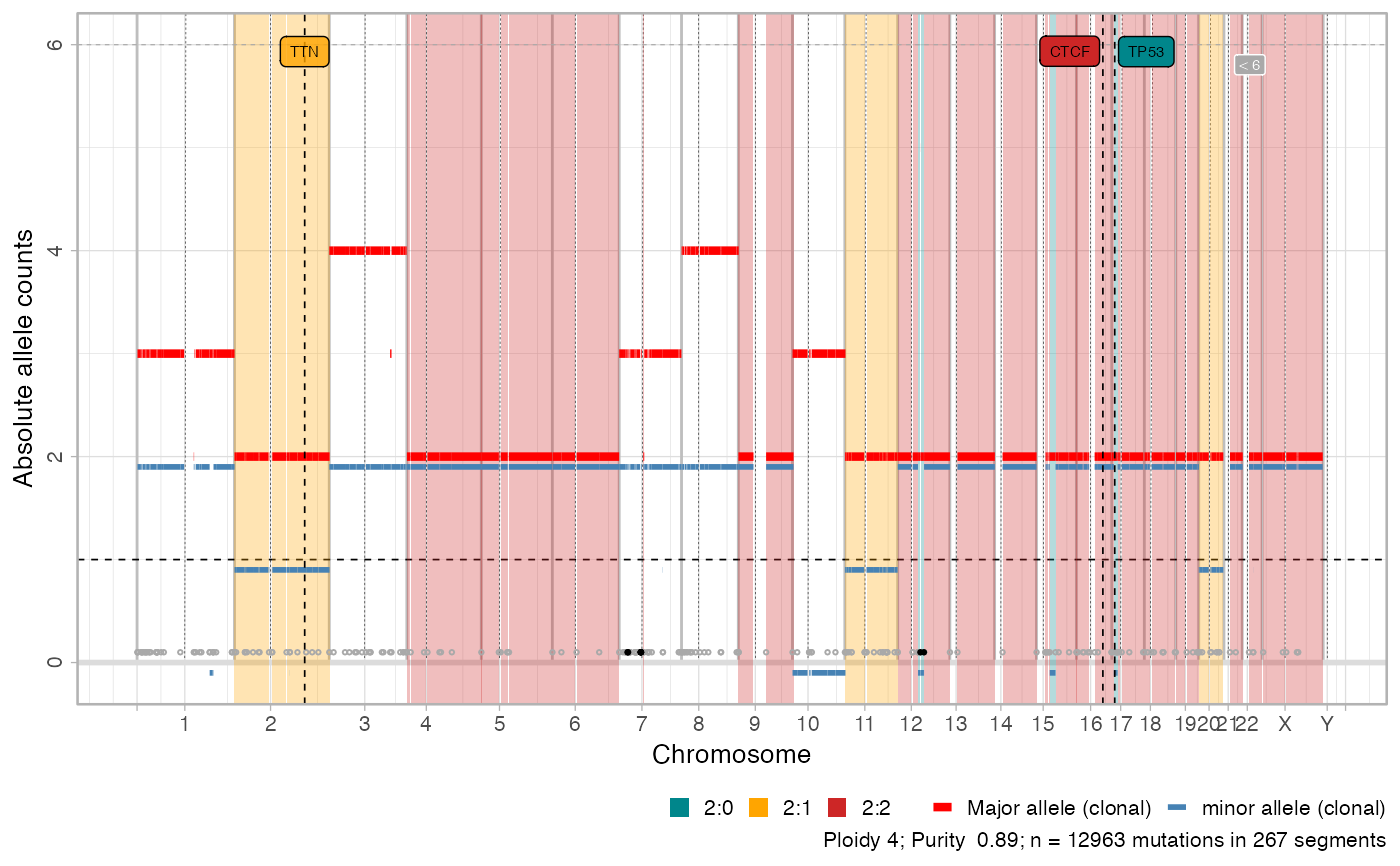
CNAqc can plot genome-wide segments showing major and minor allele counts as red and blue bars. Bottom circles annotate breakpoints; by default this plot has limited y-axis and breakpoints for segments outside the plot (e.g. very high amplifications) are in black. Areas in the genome that are mapped to the most prevalent karyotype are shadowed by default. Note that the colour scheme in CNAqc is fixed for certain segments. The colour scheme is adopted also for other information, e.g., to report the segment where a certain driver is mapped. A circular layout for this plot is also available, and total copy numbers can also be plot.
Note that two distinct colour schemas distinguish clonal and subclonal segments.
Arguments
- x
A CNAqc object.
- chromosomes
The chromosome to plot.
- max_Y_height
Maximum height for the Y-axis of the plot. Segments witht total copy number (Major plus minor) above
max_Y_heightare not showm; in that case a point annotation is put on top of the plot, andmax_Y_heightis annotated in the grid.- circular
Uses a circular layout in polar coordinates to make the segments look like a circos plot. This visualisation can save space.
- cn
Type of copy number segment to show on the plot. Either
"absolute"for Major and minor annotation, or"total"for the total (Major plus minor) annotation.- highlight
A list of karyotype ids in
"Major:minor"notation (e.g.,"1:1", "2,1", ...) that will be shadowed with a transparent area. By default, it plots the most prevalent karyotype using `x$most_prevalent_karyotype`.- highlight_QC
Similar to
highlightbut shadows segments based on the QC results and takes a boolean as an input. By default, it overrrideshighlight, while if no peak analysis has been performed reverts back tohighlight- ...
Extra parameters passed to the hidden function
blank_genome.
Value
A ggplot2 plot.
Examples
data('example_dataset_CNAqc', package = 'CNAqc')
x = init(mutations = example_dataset_CNAqc$mutations, cna = example_dataset_CNAqc$cna, purity = example_dataset_CNAqc$purity)
#>
#> ── CNAqc - CNA Quality Check ───────────────────────────────────────────────────
#>
#> ℹ Using reference genome coordinates for: GRCh38.
#> ✔ Found annotated driver mutations: TTN, CTCF, and TP53.
#> ✔ Fortified calls for 12963 somatic mutations: 12963 SNVs (100%) and 0 indels.
#> ! CNAs have no CCF, assuming clonal CNAs (CCF = 1).
#> ✔ Fortified CNAs for 267 segments: 267 clonal and 0 subclonal.
#> ✔ 12963 mutations mapped to clonal CNAs.
# Default view, works for most cases
plot_segments(x)
#> Scale for fill is already present.
#> Adding another scale for fill, which will replace the existing scale.
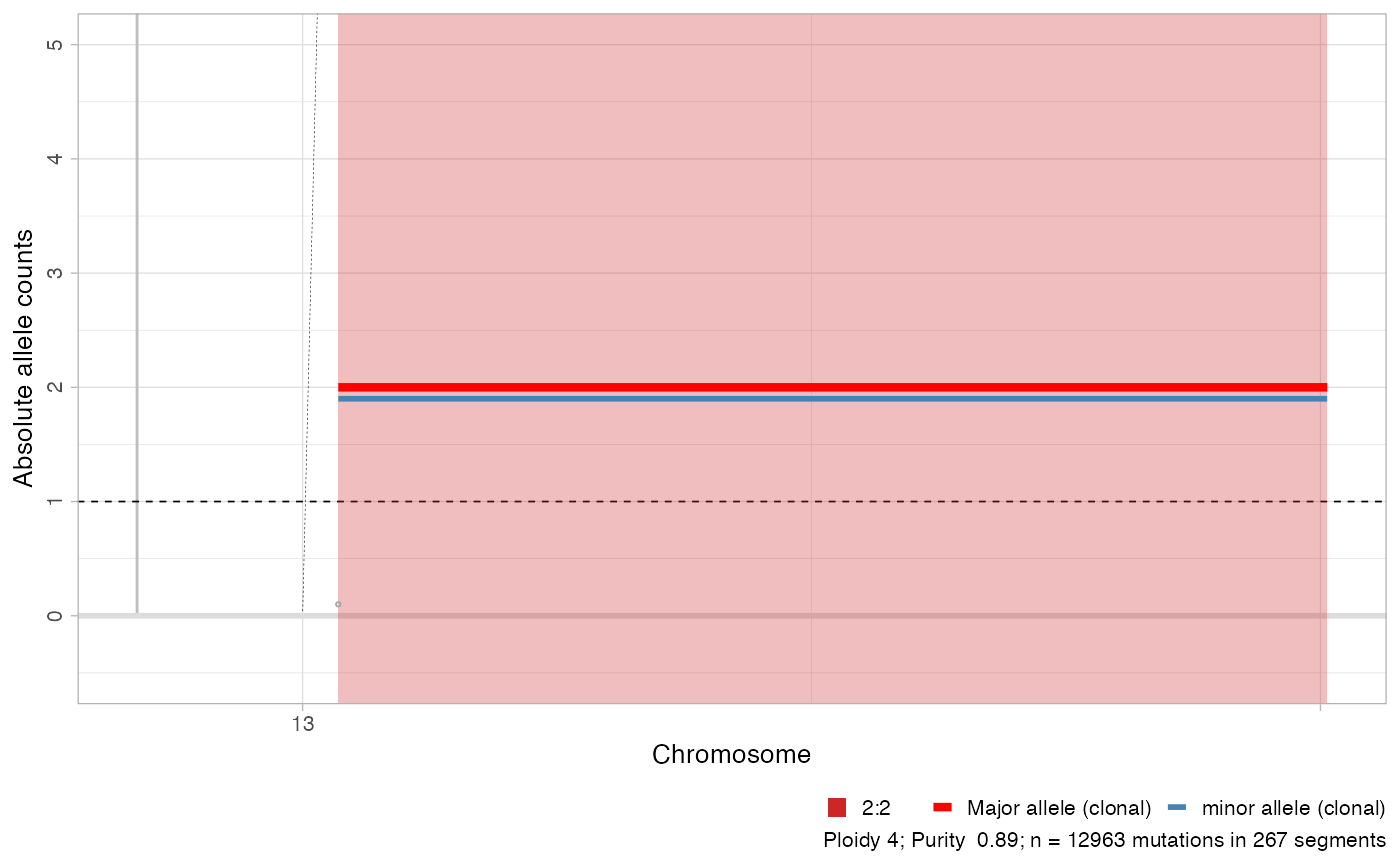
 # A subset of chromosomes
plot_segments(x, chromosomes = 'chr13')
# A subset of chromosomes
plot_segments(x, chromosomes = 'chr13')
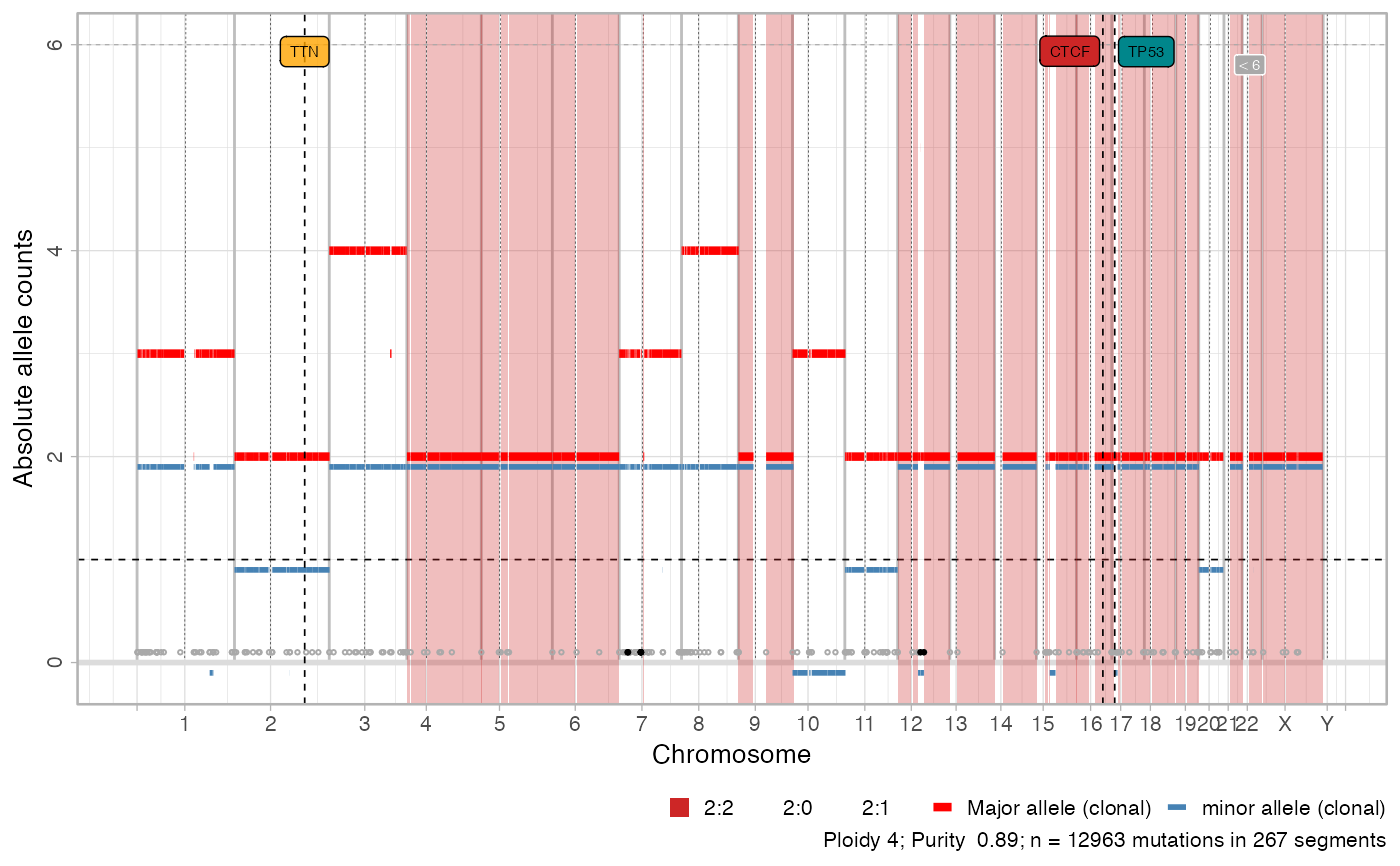
 # Total CNAs
plot_segments(x, cn = 'total')
#> Scale for fill is already present.
#> Adding another scale for fill, which will replace the existing scale.
# Total CNAs
plot_segments(x, cn = 'total')
#> Scale for fill is already present.
#> Adding another scale for fill, which will replace the existing scale.
 # Shadows all simple clonal CNAs
plot_segments(x, highlight = c('1:0', '1:1', '2:0', '2:1', '2:2'))
#> Scale for fill is already present.
#> Adding another scale for fill, which will replace the existing scale.
# Shadows all simple clonal CNAs
plot_segments(x, highlight = c('1:0', '1:1', '2:0', '2:1', '2:2'))
#> Scale for fill is already present.
#> Adding another scale for fill, which will replace the existing scale.