Results from analyze_peaks and compute_CCF can be
visualised with this function. Compared to individual karyotypes fits available
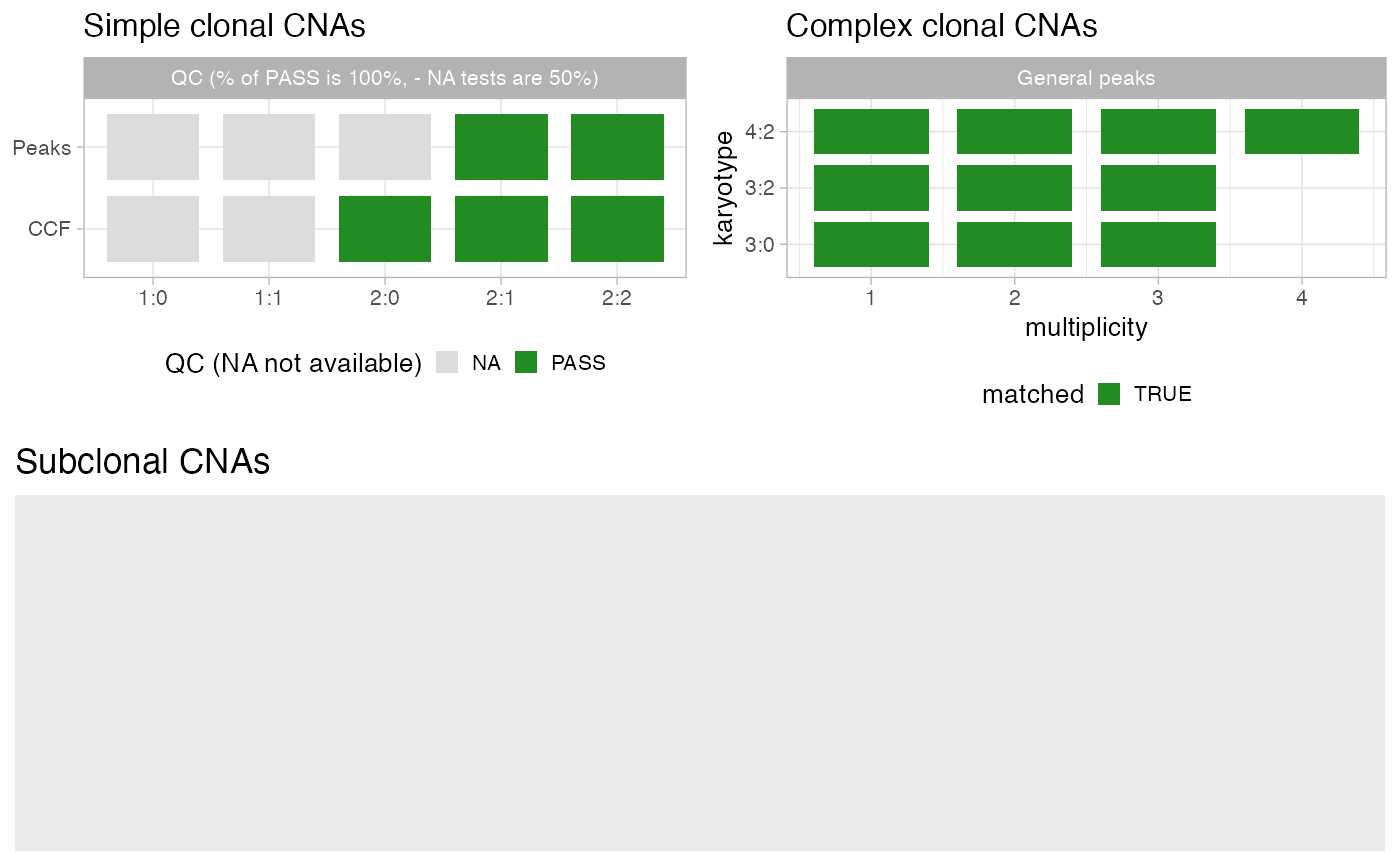
with function plot_peaks_analysis, for instance, this function reports
summary pass/fail statistics for each analysis.
plot_qc(x)Value
A ggplot2 plot
Examples
data('example_dataset_CNAqc', package = 'CNAqc')
x = init(mutations = example_dataset_CNAqc$mutations, cna = example_dataset_CNAqc$cna, purity = example_dataset_CNAqc$purity)
#>
#> ── CNAqc - CNA Quality Check ───────────────────────────────────────────────────
#>
#> ℹ Using reference genome coordinates for: GRCh38.
#> ✔ Found annotated driver mutations: TTN, CTCF, and TP53.
#> ✔ Fortified calls for 12963 somatic mutations: 12963 SNVs (100%) and 0 indels.
#> ! CNAs have no CCF, assuming clonal CNAs (CCF = 1).
#> ✔ Fortified CNAs for 267 segments: 267 clonal and 0 subclonal.
#> ✔ 12963 mutations mapped to clonal CNAs.

x = analyze_peaks(x)
#>
#> ── Peak analysis: simple CNAs ──────────────────────────────────────────────────
#>
#> ℹ Analysing 9041 mutations mapping to karyotype(s) 2:1 and 2:2.
#> ℹ Mixed type peak detection for karyotype 2:1 (1563 mutations)
#> ℹ Mixed type peak detection for karyotype 2:2 (7478 mutations)
#> # A tibble: 4 × 16
#> # Rowwise:
#>   mutation_multiplicity karyotype  peak delta_vaf     x     y counts_per_bin
#>                   <dbl> <chr>     <dbl>     <dbl> <dbl> <dbl>          <int>
#> 1                     1 2:1       0.308   0.0120  0.306  3.60             59
#> 2                     2 2:1       0.616   0.0239  0.600  2.93             60
#> 3                     1 2:2       0.235   0.00700 0.24   0.85             65
#> 4                     2 2:2       0.471   0.0140  0.461  8.13            625
#> # ℹ 9 more variables: discarded <lgl>, from <chr>, offset_VAF <dbl>,
#> #   offset <dbl>, weight <dbl>, epsilon <dbl>, VAF_tolerance <dbl>,
#> #   matched <lgl>, QC <chr>
#> ✔ Peak detection PASS with r = 0.00838466599059723 - maximum purity error ε = 0.05.
#> Joining with `by = join_by(Major, minor)`
#> Joining with `by = join_by(karyotype)`
#>
#> ── Peak analysis: complex CNAs ─────────────────────────────────────────────────
#>
#> ℹ Karyotypes 3:0, 3:2, and 4:2 with >100 mutation(s). Using epsilon = 0.05.
#> # A tibble: 3 × 5
#> # Groups:   karyotype, matched [3]
#>   karyotype     n matched mismatched  prop
#>   <chr>     <int>   <int>      <dbl> <dbl>
#> 1 3:0         312       3          0     1
#> 2 3:2        1625       3          0     1
#> 3 4:2        1893       4          0     1
#> Adding missing grouping variables: `matched`
#> Joining with `by = join_by(Major, minor, QC_PASS)`
#> Adding missing grouping variables: `matched`
#> Joining with `by = join_by(karyotype, QC_PASS)`
#>
#> ── Peak analysis: subclonal CNAs ───────────────────────────────────────────────
#>
#> ℹ No subclonal CNAs in this sample.
x = compute_CCF(x)
#> Warning: Some karyotypes have fewer than25and will not be analysed.
#> ── Computing mutation multiplicity for karyotype 2:0 using the entropy method. ─
#> ℹ Expected Binomial peak(s) for these calls (1 and 2 copies): 0.445 and 0.89
#> ℹ Mixing pre/ post aneuploidy: 0.09 and 0.91
#> ℹ Not assignamble area: [0.631578947368421; 0.723684210526316]
#> ── Computing mutation multiplicity for karyotype 2:1 using the entropy method. ─
#> ℹ Expected Binomial peak(s) for these calls (1 and 2 copies): 0.307958477508651 and 0.615916955017301
#> ℹ Mixing pre/ post aneuploidy: 0.55 and 0.45
#> ℹ Not assignamble area: [0.423423423423423; 0.504504504504504]
#> ── Computing mutation multiplicity for karyotype 2:2 using the entropy method. ─
#> ℹ Expected Binomial peak(s) for these calls (1 and 2 copies): 0.235449735449735 and 0.470899470899471
#> ℹ Mixing pre/ post aneuploidy: 0.09 and 0.91
#> ℹ Not assignamble area: [0.290780141843972; 0.368794326241135]

plot_qc(x)