One can have multiple CNAqc objects - i.e., work with a cohort of objects - when working with:
- a group of distinct patients; - multiple samples from the same patient; - multiple calls from the same sample;
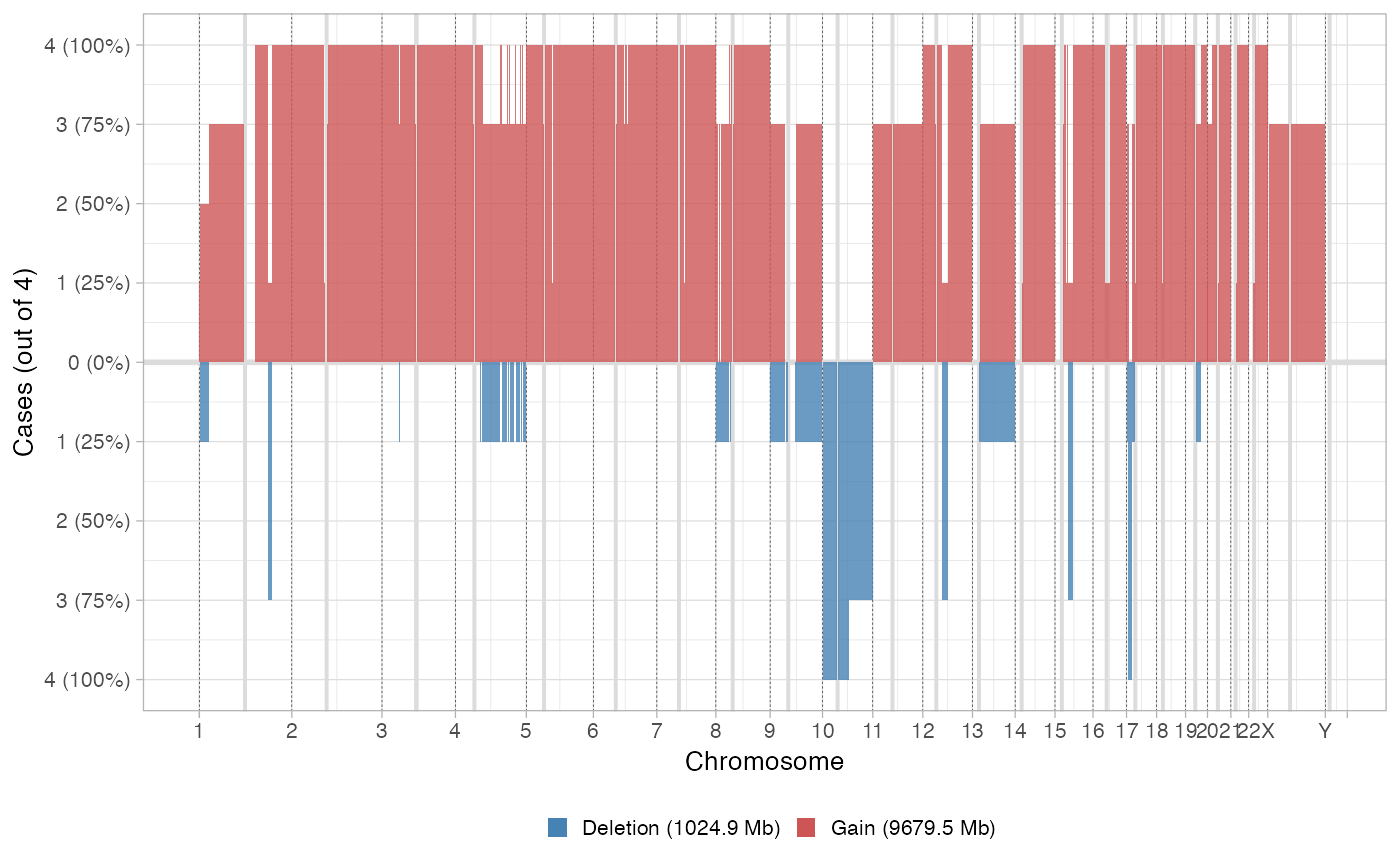
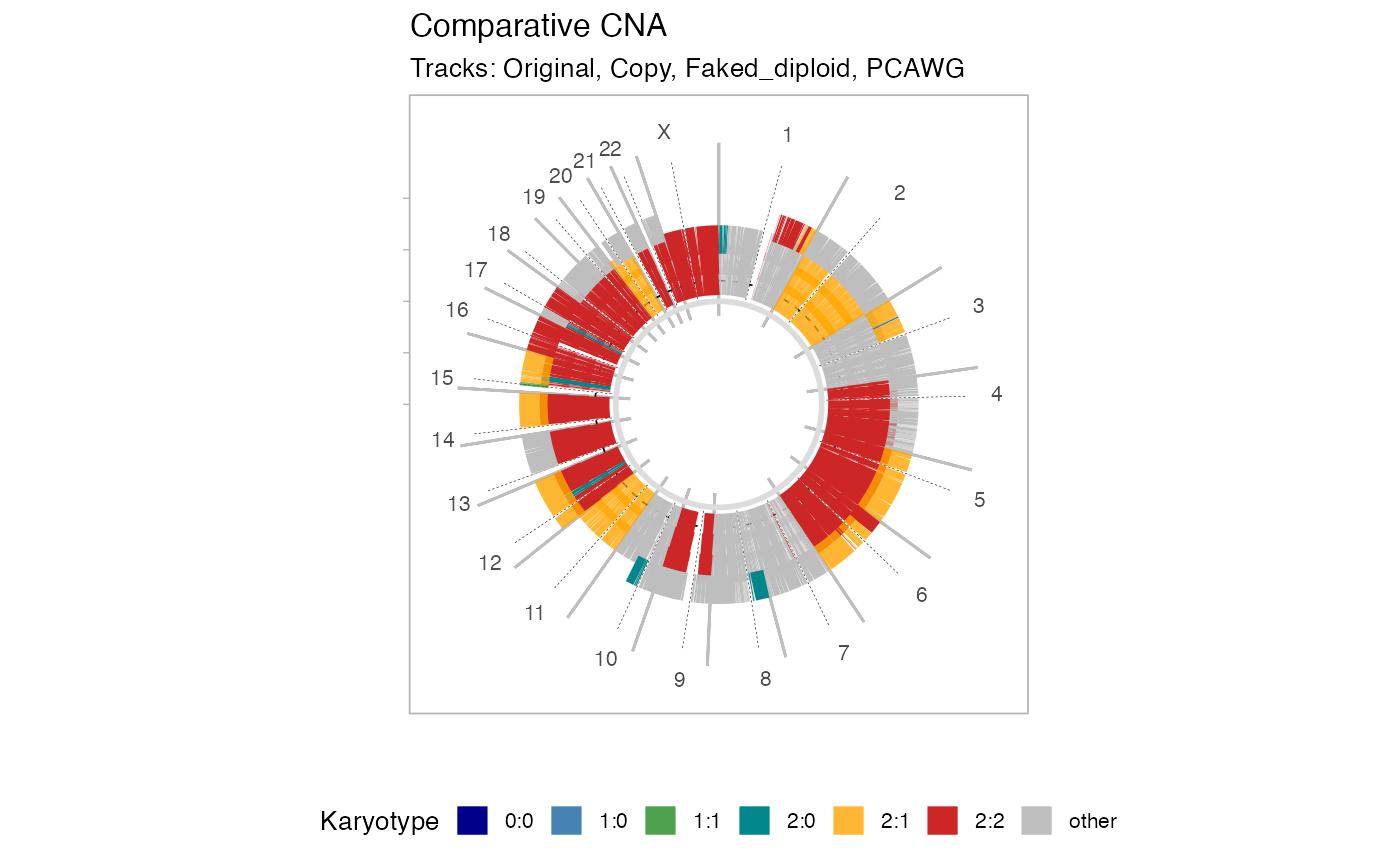
Assuming all input objects have the same reference, cohort cohort-level plots are possible with this function. Two layouts are possible:
* Flat layout: classical layout where the amount of deletions and gains are reported with a certain discretized binning of the input tumour genome. Deletions are anything with an LOH state; gains must have more than 3 copies. * Circular layout: plot the Major and minor alleles of each segment, each sample is plot on a lane, like in a donut plot.
plot_multisample_CNA(x, layout = "flat", ...)Arguments
Value
A `ggplot2` plot.
Examples
data('example_dataset_CNAqc', package = 'CNAqc')

# We build faking it to be hg19, otherwise we cannot blend it with PCAWG
x = CNAqc::init(mutations = example_dataset_CNAqc$mutations, cna = example_dataset_CNAqc$cna, purity = example_dataset_CNAqc$purity, ref = 'hg19')
#>
#> ── CNAqc - CNA Quality Check ───────────────────────────────────────────────────
#>
#> ℹ Using reference genome coordinates for: hg19.
#> ✔ Found annotated driver mutations: TTN, CTCF, and TP53.
#> ✔ Fortified calls for 12963 somatic mutations: 12963 SNVs (100%) and 0 indels.
#> ! CNAs have no CCF, assuming clonal CNAs (CCF = 1).
#> ✔ Fortified CNAs for 267 segments: 267 clonal and 0 subclonal.
#> ✔ 12963 mutations mapped to clonal CNAs.

# Add some example deletion
x2 = x
x2$cna$Major[1:10] = 2
x2$cna$minor[1:10] = 0

#PCAWG sample
z = CNAqc::example_PCAWG

# Inputs need to be wrapped in a named list
inputs = list(`Original` = x, `Copy` = x, `Faked_diploid` = x2, `PCAWG` = z)

plot_multisample_CNA(inputs)
#>
#> ── Breaking input segments at 100 Kb resolution


# Circular layout
plot_multisample_CNA(inputs, layout = 'circular')
#> Warning: The `size` argument of `element_rect()` is deprecated as of ggplot2 3.4.0.
#> ℹ Please use the `linewidth` argument instead.
#> ℹ The deprecated feature was likely used in the CNAqc package.
#>   Please report the issue at <https://github.com/caravagnalab/CNAqc/issues>.
