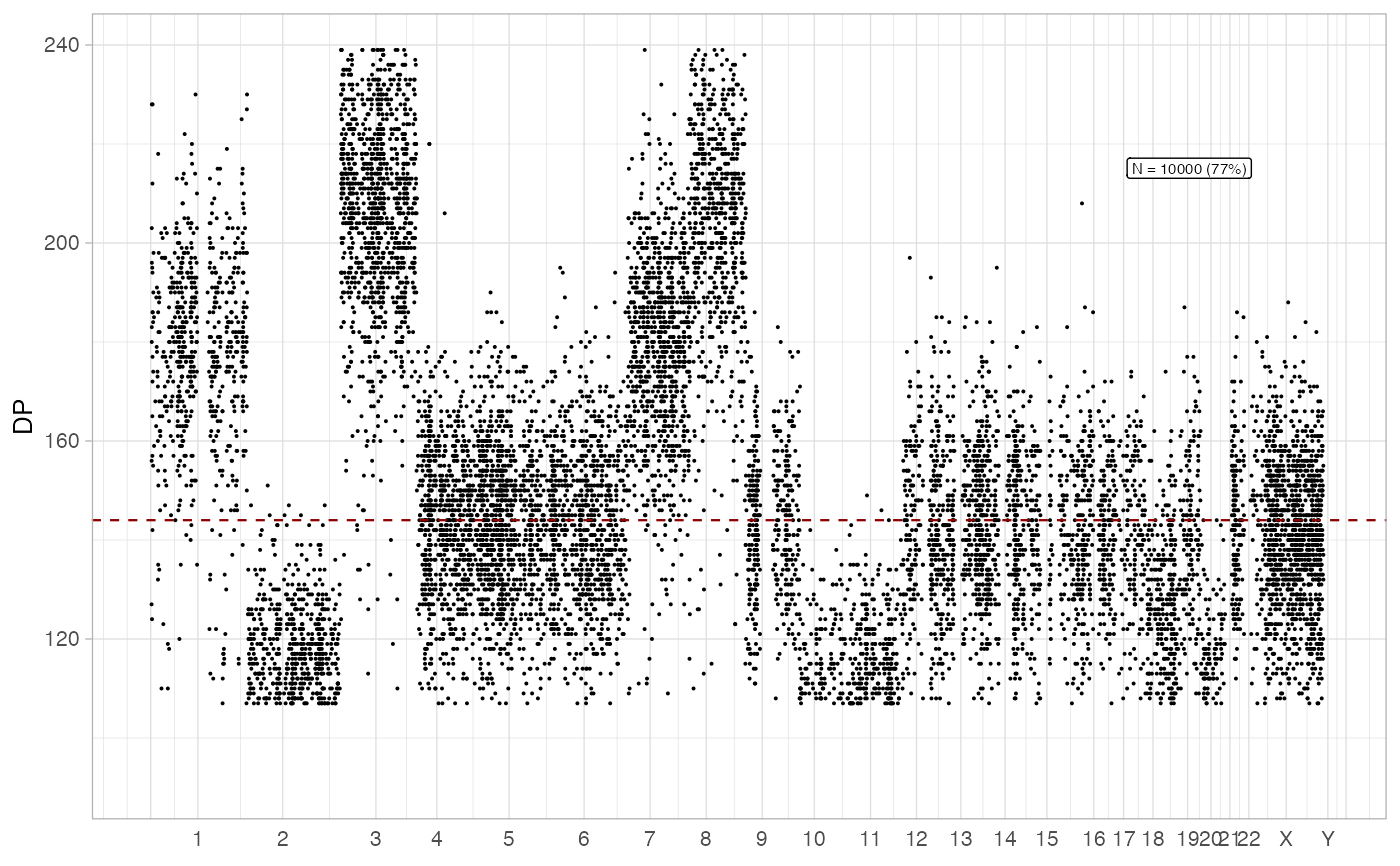
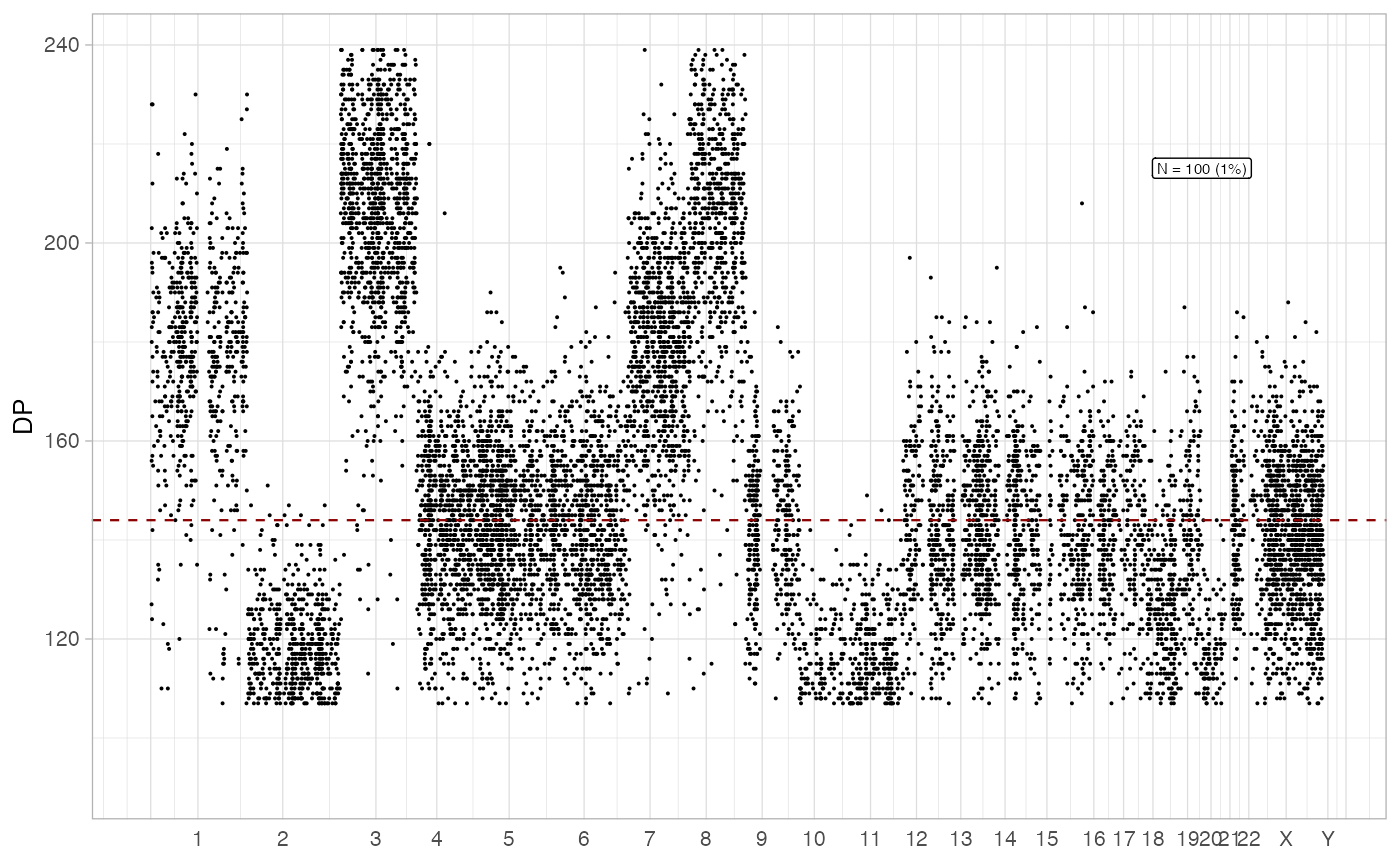
Plot a genome-wide scatter plot of mutation depths. The function can randomly subset the points to show.
Arguments
Value
A ggplot2 plot.
Examples
data('example_dataset_CNAqc', package = 'CNAqc')
x = init(mutations = example_dataset_CNAqc$mutations, cna = example_dataset_CNAqc$cna, purity = example_dataset_CNAqc$purity)
#>
#> ── CNAqc - CNA Quality Check ───────────────────────────────────────────────────
#>
#> ℹ Using reference genome coordinates for: GRCh38.
#> ✔ Found annotated driver mutations: TTN, CTCF, and TP53.
#> ✔ Fortified calls for 12963 somatic mutations: 12963 SNVs (100%) and 0 indels.
#> ! CNAs have no CCF, assuming clonal CNAs (CCF = 1).
#> ✔ Fortified CNAs for 267 segments: 267 clonal and 0 subclonal.
#> ✔ 12963 mutations mapped to clonal CNAs.
plot_gw_depth(x)
#> Warning: Removed 24 rows containing missing values or values outside the scale range
#> (`geom_segment()`).
#> Warning: Removed 1 row containing missing values or values outside the scale range
#> (`geom_hline()`).
#> Warning: Removed 1 row containing missing values or values outside the scale range
#> (`geom_hline()`).
 # Downsampling examples
plot_gw_depth(x, N = 100)
#> Warning: Removed 24 rows containing missing values or values outside the scale range
#> (`geom_segment()`).
#> Warning: Removed 1 row containing missing values or values outside the scale range
#> (`geom_hline()`).
#> Warning: Removed 1 row containing missing values or values outside the scale range
#> (`geom_hline()`).
# Downsampling examples
plot_gw_depth(x, N = 100)
#> Warning: Removed 24 rows containing missing values or values outside the scale range
#> (`geom_segment()`).
#> Warning: Removed 1 row containing missing values or values outside the scale range
#> (`geom_hline()`).
#> Warning: Removed 1 row containing missing values or values outside the scale range
#> (`geom_hline()`).
 plot_gw_depth(x, N = 1000)
#> Warning: Removed 24 rows containing missing values or values outside the scale range
#> (`geom_segment()`).
#> Warning: Removed 1 row containing missing values or values outside the scale range
#> (`geom_hline()`).
#> Warning: Removed 1 row containing missing values or values outside the scale range
#> (`geom_hline()`).
plot_gw_depth(x, N = 1000)
#> Warning: Removed 24 rows containing missing values or values outside the scale range
#> (`geom_segment()`).
#> Warning: Removed 1 row containing missing values or values outside the scale range
#> (`geom_hline()`).
#> Warning: Removed 1 row containing missing values or values outside the scale range
#> (`geom_hline()`).
 plot_gw_depth(x, N = 10000)
#> Warning: Removed 24 rows containing missing values or values outside the scale range
#> (`geom_segment()`).
#> Warning: Removed 1 row containing missing values or values outside the scale range
#> (`geom_hline()`).
#> Warning: Removed 1 row containing missing values or values outside the scale range
#> (`geom_hline()`).
plot_gw_depth(x, N = 10000)
#> Warning: Removed 24 rows containing missing values or values outside the scale range
#> (`geom_segment()`).
#> Warning: Removed 1 row containing missing values or values outside the scale range
#> (`geom_hline()`).
#> Warning: Removed 1 row containing missing values or values outside the scale range
#> (`geom_hline()`).