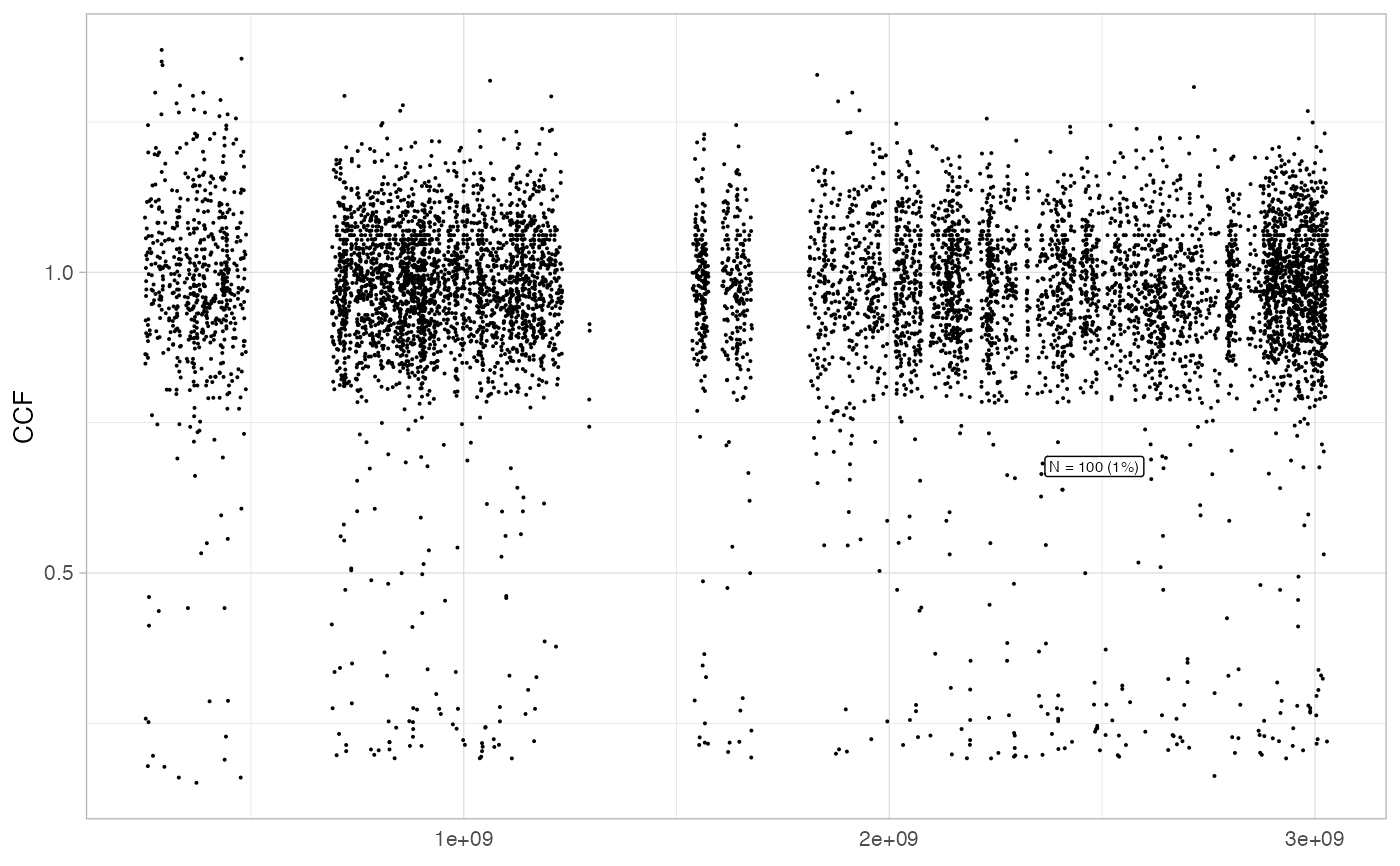
Plot a genome-wide scatter plot of mutation CCFs, if availbale. The function can randomly subset the points to show.
Arguments
Value
A ggplot2 plot.
Examples
data('example_dataset_CNAqc', package = 'CNAqc')
x = init(mutations = example_dataset_CNAqc$mutations, cna = example_dataset_CNAqc$cna, purity = example_dataset_CNAqc$purity)
#>
#> ── CNAqc - CNA Quality Check ───────────────────────────────────────────────────
#>
#> ℹ Using reference genome coordinates for: GRCh38.
#> ✔ Found annotated driver mutations: TTN, CTCF, and TP53.
#> ✔ Fortified calls for 12963 somatic mutations: 12963 SNVs (100%) and 0 indels.
#> ! CNAs have no CCF, assuming clonal CNAs (CCF = 1).
#> ✔ Fortified CNAs for 267 segments: 267 clonal and 0 subclonal.
#> ✔ 12963 mutations mapped to clonal CNAs.
# Compute CCFs
x = compute_CCF(x)
#> Warning: Some karyotypes have fewer than25and will not be analysed.
#> ── Computing mutation multiplicity for karyotype 2:0 using the entropy method. ─
#> ℹ Expected Binomial peak(s) for these calls (1 and 2 copies): 0.445 and 0.89
#> ℹ Mixing pre/ post aneuploidy: 0.09 and 0.91
#> ℹ Not assignamble area: [0.631578947368421; 0.723684210526316]
#> ── Computing mutation multiplicity for karyotype 2:1 using the entropy method. ─
#> ℹ Expected Binomial peak(s) for these calls (1 and 2 copies): 0.307958477508651 and 0.615916955017301
#> ℹ Mixing pre/ post aneuploidy: 0.55 and 0.45
#> ℹ Not assignamble area: [0.423423423423423; 0.504504504504504]
#> ── Computing mutation multiplicity for karyotype 2:2 using the entropy method. ─
#> ℹ Expected Binomial peak(s) for these calls (1 and 2 copies): 0.235449735449735 and 0.470899470899471
#> ℹ Mixing pre/ post aneuploidy: 0.09 and 0.91
#> ℹ Not assignamble area: [0.290780141843972; 0.368794326241135]
plot_gw_ccf(x)
#> Warning: Removed 141 rows containing missing values or values outside the scale range
#> (`geom_point()`).
#> Warning: Removed 1 row containing missing values or values outside the scale range
#> (`geom_hline()`).
 # Downsampling examples
plot_gw_ccf(x, N = 100)
#> Warning: Removed 141 rows containing missing values or values outside the scale range
#> (`geom_point()`).
#> Warning: Removed 1 row containing missing values or values outside the scale range
#> (`geom_hline()`).
# Downsampling examples
plot_gw_ccf(x, N = 100)
#> Warning: Removed 141 rows containing missing values or values outside the scale range
#> (`geom_point()`).
#> Warning: Removed 1 row containing missing values or values outside the scale range
#> (`geom_hline()`).
 plot_gw_ccf(x, N = 1000)
#> Warning: Removed 141 rows containing missing values or values outside the scale range
#> (`geom_point()`).
#> Warning: Removed 1 row containing missing values or values outside the scale range
#> (`geom_hline()`).
plot_gw_ccf(x, N = 1000)
#> Warning: Removed 141 rows containing missing values or values outside the scale range
#> (`geom_point()`).
#> Warning: Removed 1 row containing missing values or values outside the scale range
#> (`geom_hline()`).
 plot_gw_ccf(x, N = 10000)
#> Warning: Removed 141 rows containing missing values or values outside the scale range
#> (`geom_point()`).
#> Warning: Removed 1 row containing missing values or values outside the scale range
#> (`geom_hline()`).
plot_gw_ccf(x, N = 10000)
#> Warning: Removed 141 rows containing missing values or values outside the scale range
#> (`geom_point()`).
#> Warning: Removed 1 row containing missing values or values outside the scale range
#> (`geom_hline()`).
