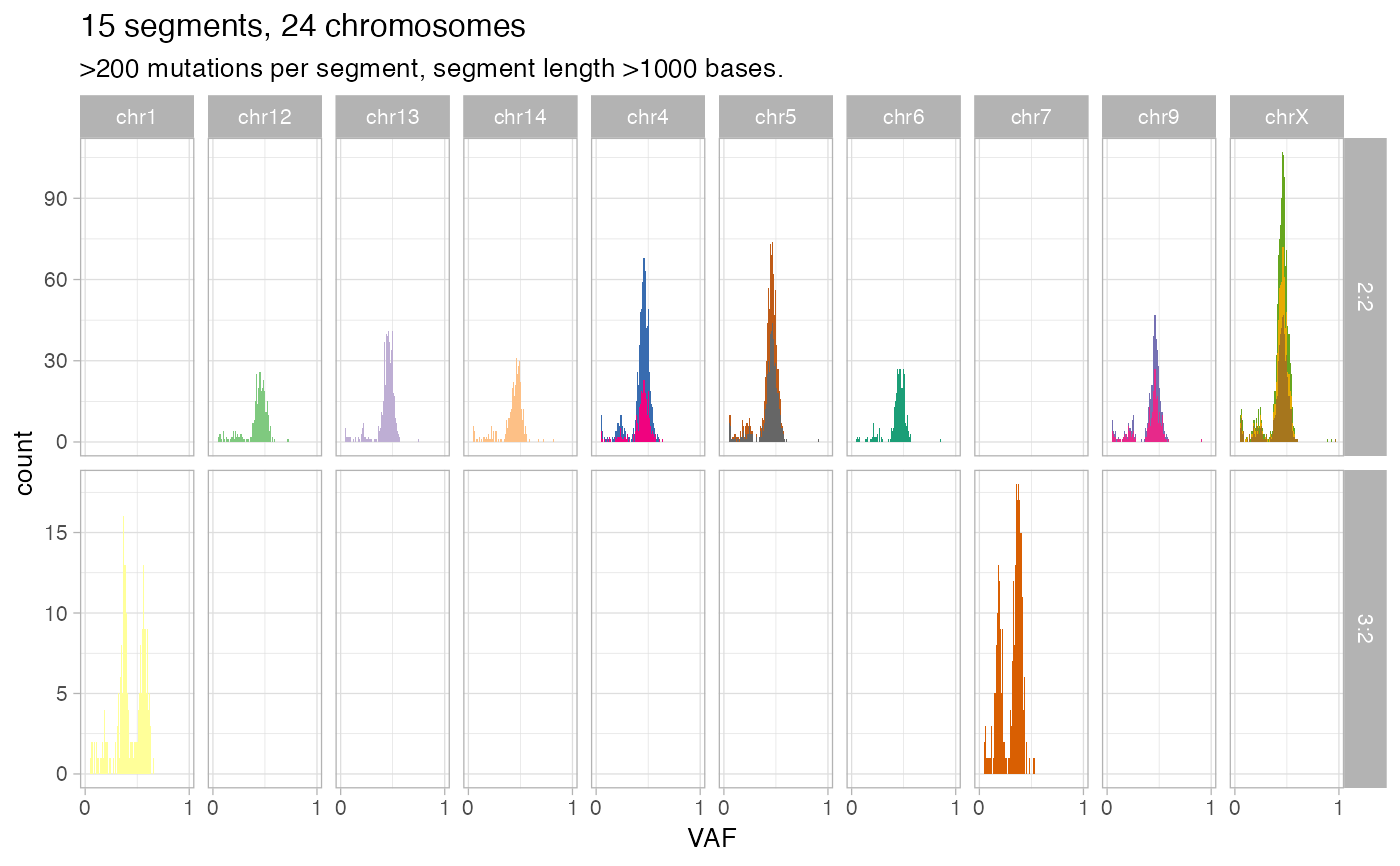
Plot VAFs across chromosomes for mutations mapping to clonal simple CNAs. FIlters can be used to subset the data. Every segment has a colour, and maximum 74 segements can be plotted. The plots are split by chromosome and karyotype.
Arguments
Value
A `ggplot2` object.
Examples
data('example_dataset_CNAqc', package = 'CNAqc')
x = init(mutations = example_dataset_CNAqc$mutations, cna = example_dataset_CNAqc$cna, purity = example_dataset_CNAqc$purity)
#>
#> ── CNAqc - CNA Quality Check ───────────────────────────────────────────────────
#>
#> ℹ Using reference genome coordinates for: GRCh38.
#> ✔ Found annotated driver mutations: TTN, CTCF, and TP53.
#> ✔ Fortified calls for 12963 somatic mutations: 12963 SNVs (100%) and 0 indels.
#> ! CNAs have no CCF, assuming clonal CNAs (CCF = 1).
#> ✔ Fortified CNAs for 267 segments: 267 clonal and 0 subclonal.
#> ✔ 12963 mutations mapped to clonal CNAs.

# Deafault segments -- all chromsomes, at least 1KB, at least 200 mapped mutations.
inspect_segment(x)
#> Warning: The `<scale>` argument of `guides()` cannot be `FALSE`. Use "none" instead as
#> of ggplot2 3.3.4.
#> ℹ The deprecated feature was likely used in the CNAqc package.
#>   Please report the issue at <https://github.com/caravagnalab/CNAqc/issues>.
#> Warning: Removed 30 rows containing missing values or values outside the scale range
#> (`geom_bar()`).


# Same as above, but only for chromosome 2
inspect_segment(x, chrs = 'chr2', n = 50)
#> Warning: Removed 16 rows containing missing values or values outside the scale range
#> (`geom_bar()`).
