Searching rectangular tissue samples
Source:R/RcppExports.R
SpatialSimulation-cash-search_samples.RdThis method searches a set of rectangular tissue samples.
Arguments
- min_num_of_cells
A named integer vector reporting the minimum number of cells per species or mutant.
- num_of_cells
The number of cells in the searched sample.
- width
The width of the searched sample.
- height
The height of the searched sample.
- n_samples
The number of searched samples.
- seed
The seed of the random generator the select the samples among those satisfying the constraints (optional).
Details
The aimed samples mush satisfy the specified number of cells. The sizes of the samples are also provided a parameter of the method. This method takes asymptotic time \(\Theta(|\textrm{tissue width}|*|\textrm{tissue height}|)\).
Examples
# set the seed of the random number generator
set.seed(0)
# create a simulation
sim <- SpatialSimulation()
sim$death_activation_level <- 50
sim$add_mutant(name = "A", growth_rate = 0.2, death_rate = 0.01)
sim$place_cell("A", 500, 500)
sim$run_up_to_size(species = "A", num_of_cells = 50)
#>
[████████████████████████████████████████] 100% [00m:00s] Saving snapshot
sim$add_mutant(name = "B", growth_rate = 0.3, death_rate = 0.01)
sim$mutate_progeny(sim$choose_cell_in("A"), "B")
sim$run_up_to_size(species = "B", num_of_cells = 40000)
#>
[██████████████████----------------------] 43% [00m:00s] Cells: 44022
[████████████████████████████████--------] 78% [00m:01s] Cells: 73516
[████████████████████████████████████████] 100% [00m:01s] Saving snapshot
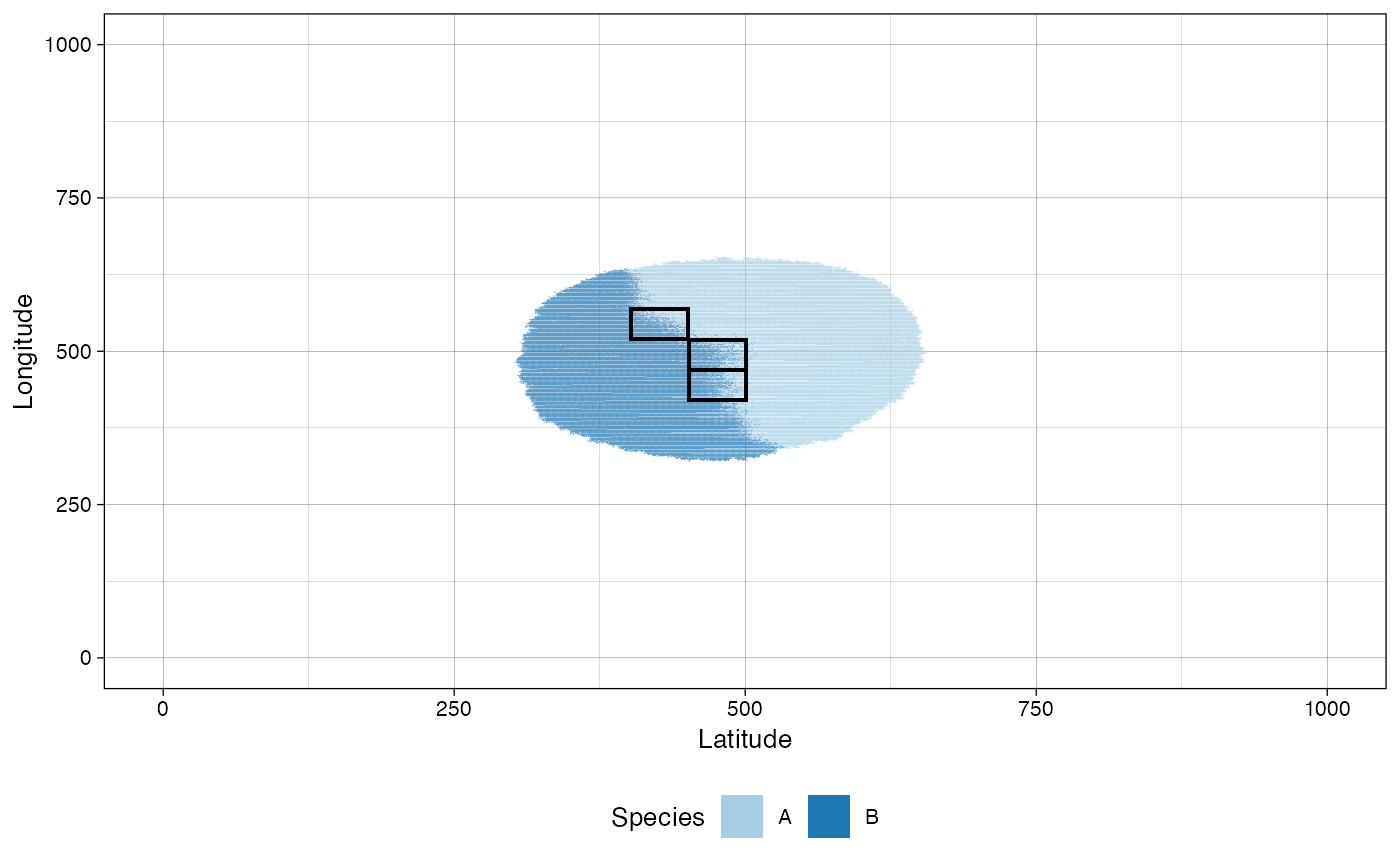
plot <- plot_tissue(sim, num_of_bins = 1000)
# find 3 50x50 samples containing 80 "B" cells and 100 "A" cells
# at least
bboxes <- sim$search_samples(c("A" = 100, "B" = 80), 50, 50,
n_samples=3)
bboxes
#> [[1]]
#> TissueRectangle((452,470),(501,519))
#>
#> [[2]]
#> TissueRectangle((402,520),(451,569))
#>
#> [[3]]
#> TissueRectangle((452,420),(501,469))
#>
# plot the bbox of the found samples
for (bbox in bboxes) {
plot <- plot +
ggplot2::geom_rect(xmin = bbox$lower_corner[1],
xmax = bbox$upper_corner[1],
ymin = bbox$lower_corner[2],
ymax = bbox$upper_corner[2],
fill = NA, color = "black")
}
plot