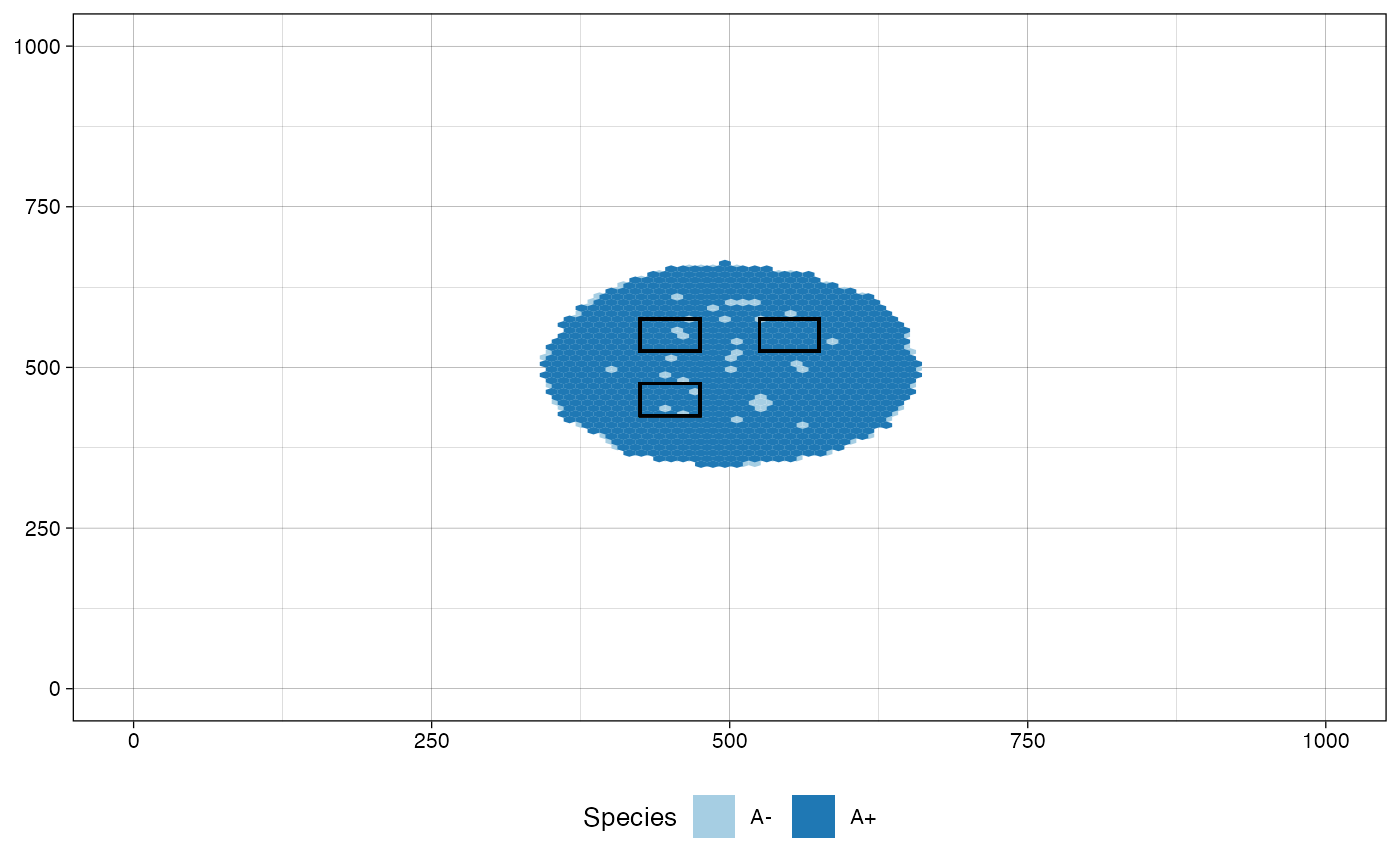
Plots cells distribution over a tissue highlighting species by color. To facilitate the plot and avoid excessive number of cells, for instance, when a simulation deals with millions of cells, the plot draws a hexagonal heatmap of 2D bins.
Usage
plot_tissue(
  simulation,
  num_of_bins = 100,
  before_sample = NULL,
  at_sample = NULL,
  plot_next_sample_regions = FALSE,
  plot_sample_region = TRUE,
  color_map = NULL,
  list_all_species = FALSE
)
Arguments
- simulation
A simulation object.
- num_of_bins
The number of bins (default: 100).
- before_sample
A sample name. When provided, this function represents the tissue as appeared just before the specified sampling. The parameters
before_sampleandat_sampleare mutually exclusive (optional).- at_sample
A sample name. When provided, this function represents the tissue as appeared when the specified sampling occurred. The parameters
before_sampleandat_sampleare mutually exclusive (optional).- plot_next_sample_regions
A Boolean value. When
before_sampleis set andplot_next_sample_regionsis set to be TRUE, this function plots the regions of the samples collected at the same simulated time of the specified sample. When, instead,at_sampleis set andplot_next_sample_regionsis set to be TRUE, the function plots the regions of the samples collected at the same simulated time of the specified sample, but not before the specified sample (default: FALSE).- plot_sample_region
A Boolean value. When either
at_sampleorbefore_sampleare set andplot_sample_regionis set to be TRUE, the function also plots the region of the specified sample (default: TRUE).- color_map
A named vector representing the simulation species color map (optional).
- list_all_species
A Boolean flag to show all species in the legend (default: FALSE).
Examples
set.seed(0)
sim <- SpatialSimulation()
sim$add_mutant(name = "A",
epigenetic_rates = c("+-" = 0.01, "-+" = 0.01),
growth_rates = c("+" = 0.2, "-" = 0.08),
death_rates = c("+" = 0.1, "-" = 0.01))
sim$place_cell("A+", 500, 500)
sim$run_up_to_size("A-", 60000)
#>
[█████████-------------------------------] 22% [00m:00s] Cells: 18504
[█████████████████-----------------------] 42% [00m:01s] Cells: 32703
[████████████████████████----------------] 58% [00m:02s] Cells: 43998
[███████████████████████████████---------] 77% [00m:03s] Cells: 55292
[███████████████████████████████████████-] 96% [00m:04s] Cells: 67964
[████████████████████████████████████████] 100% [00m:04s] Saving snapshot
# collect 3 samples: "Sample_A", "Sample_B", and "Sample_C"
sim$sample_cells("Sample_A", c(425, 425), c(475, 475))
sim$sample_cells("Sample_B", c(525, 525), c(575, 575))
sim$sample_cells("Sample_C", c(425, 525), c(475, 575))
# let the simulation evolve until the species "A-" account
# for 80000 cells
sim$run_up_to_size("A-", 80000)
#>
[████████████████████████████████--------] 79% [00m:00s] Cells: 75274
[██████████████████████████████████████--] 93% [00m:01s] Cells: 86739
[████████████████████████████████████████] 100% [00m:01s] Saving snapshot
# plot the tissue in the current status
plot_tissue(sim)
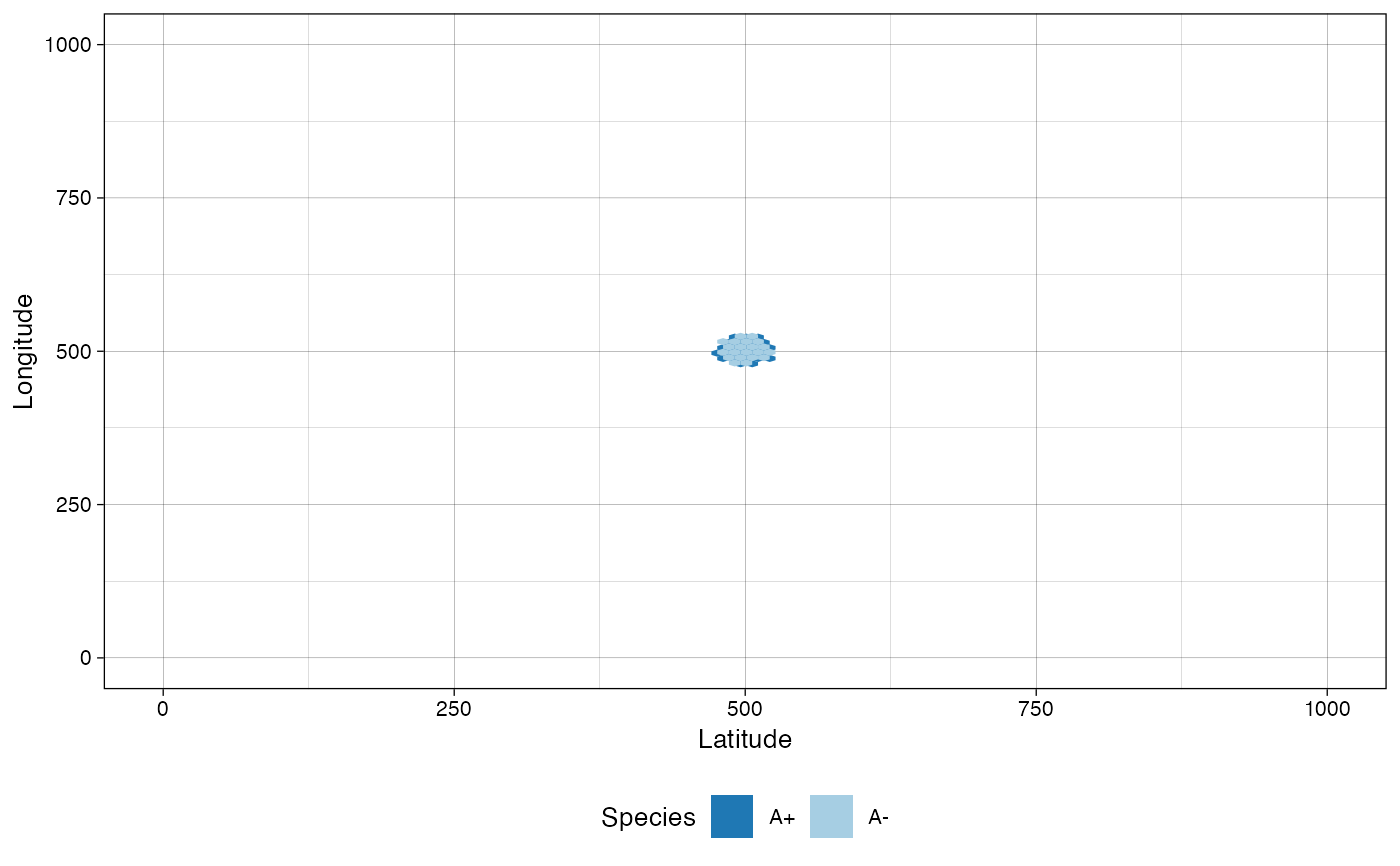 # plot the tissue as it was when "Sample_B" was collected
plot_tissue(sim, at_sample="Sample_B")
# plot the tissue as it was when "Sample_B" was collected
plot_tissue(sim, at_sample="Sample_B")
 # plot the tissue as it was when "Sample_B" was collected and
# highlight the regions of the samples collected at the same
# simulated time, but not before it, i.e., "Sample_B" and
# "Sample_C"
plot_tissue(sim, at_sample="Sample_B",
plot_next_sample_regions = TRUE)
# plot the tissue as it was when "Sample_B" was collected and
# highlight the regions of the samples collected at the same
# simulated time, but not before it, i.e., "Sample_B" and
# "Sample_C"
plot_tissue(sim, at_sample="Sample_B",
plot_next_sample_regions = TRUE)
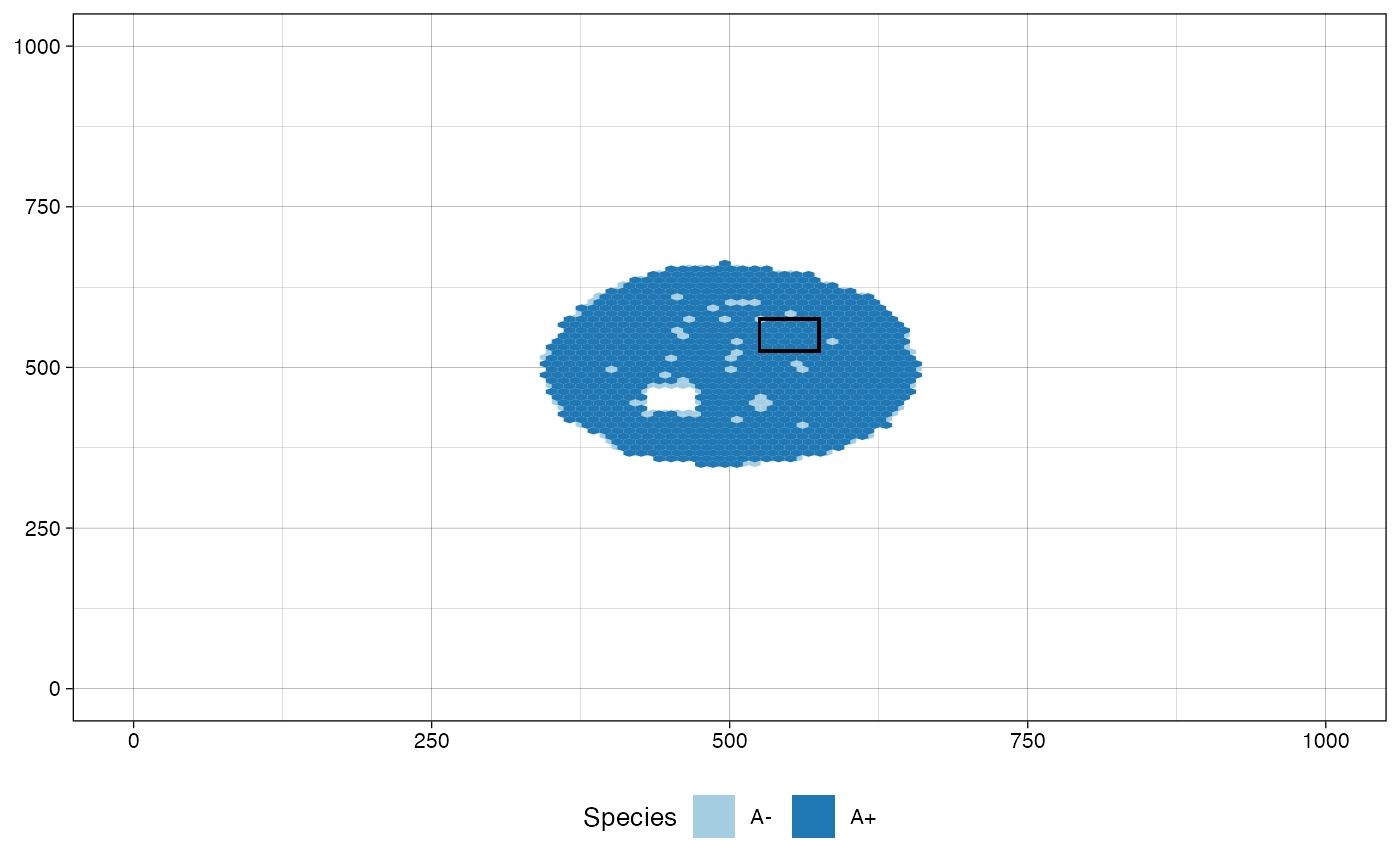
 # plot the tissue as it was just before sampling "Sample_B"
plot_tissue(sim, before_sample="Sample_B")
# plot the tissue as it was just before sampling "Sample_B"
plot_tissue(sim, before_sample="Sample_B")
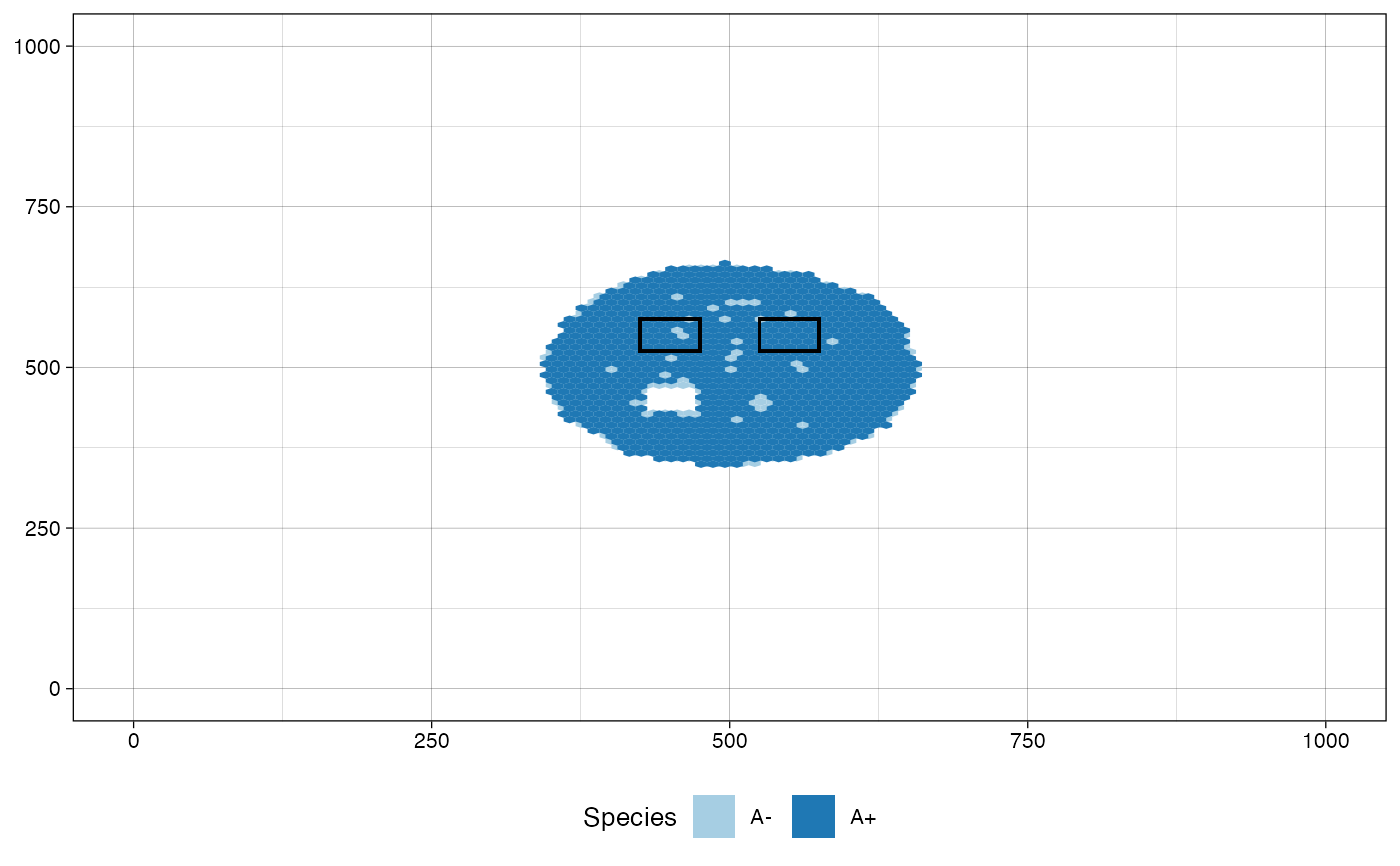
 # plot the tissue as it was just before sampling "Sample_B"
# and highlight the regions of the samples collected at the
# same simulated time, i.e., "Sample_A", "Sample_B", and
# "Sample_C"
plot_tissue(sim, before_sample="Sample_B",
plot_next_sample_regions = TRUE)
# plot the tissue as it was just before sampling "Sample_B"
# and highlight the regions of the samples collected at the
# same simulated time, i.e., "Sample_A", "Sample_B", and
# "Sample_C"
plot_tissue(sim, before_sample="Sample_B",
plot_next_sample_regions = TRUE)
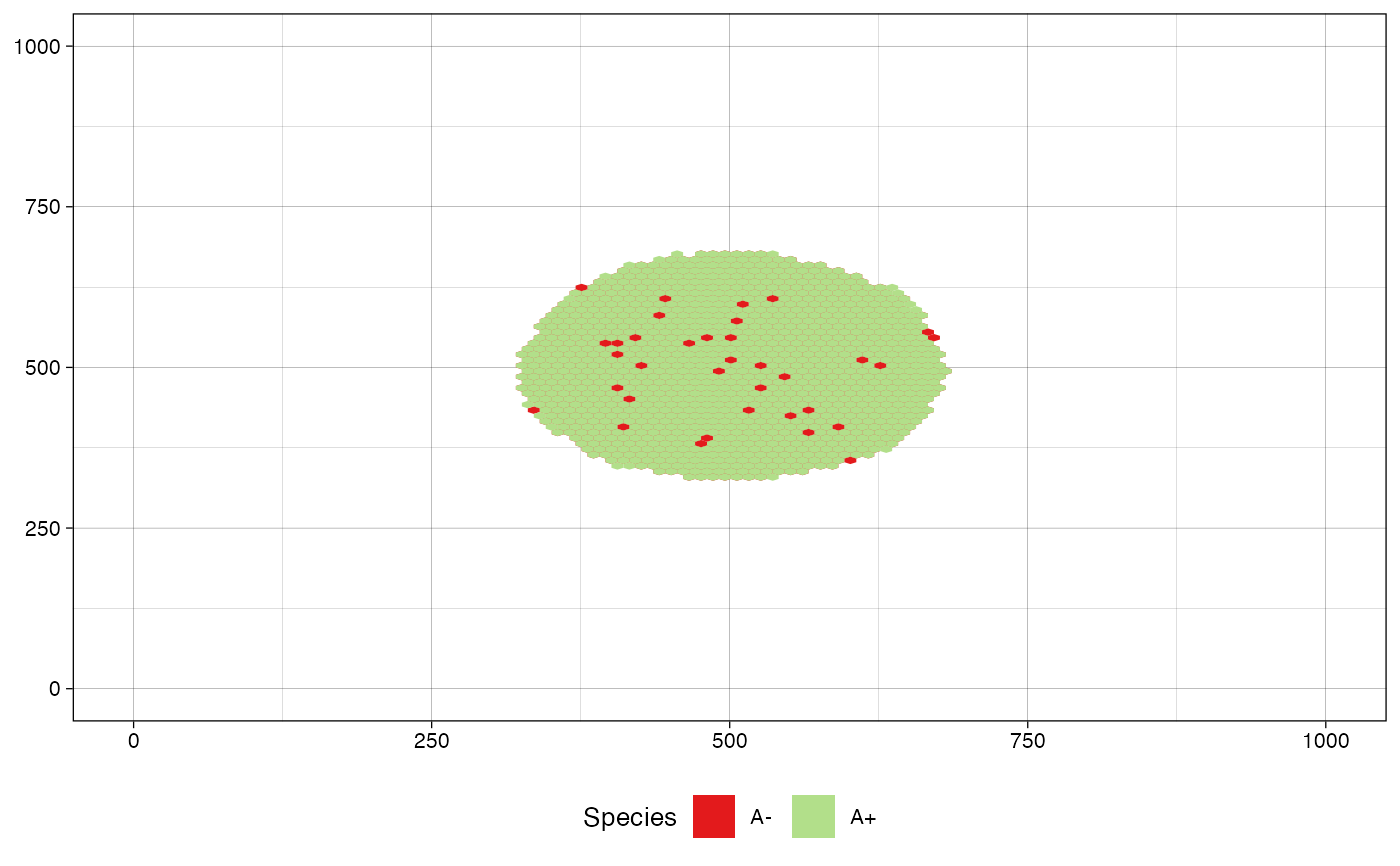
 # define a custom color map
color_map <- c("#B2DF8A", "#E31A1C")
names(color_map) <- c("A+", "A-")
plot_tissue(sim, color_map=color_map)
# define a custom color map
color_map <- c("#B2DF8A", "#E31A1C")
names(color_map) <- c("A+", "A-")
plot_tissue(sim, color_map=color_map)