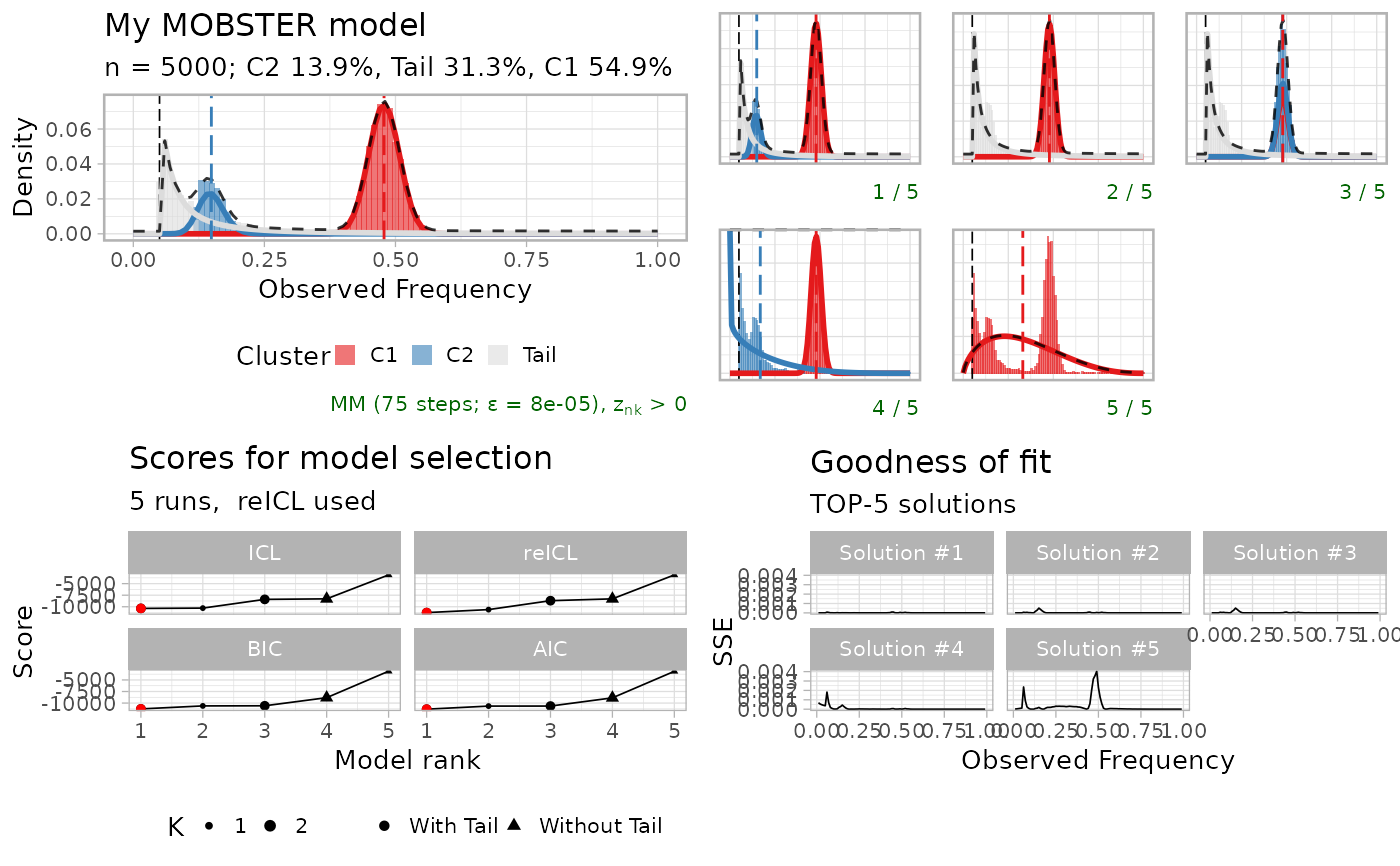
This plot is usefull to understand the different fits and their rank with respect to some scoring used to select the best model. The plot shows alternative solutions and their rank as well.
Examples
data('fit_example', package = 'mobster')
plot_model_selection(fit_example)
#> Required TOP-6 solutions, but only 5 are available.