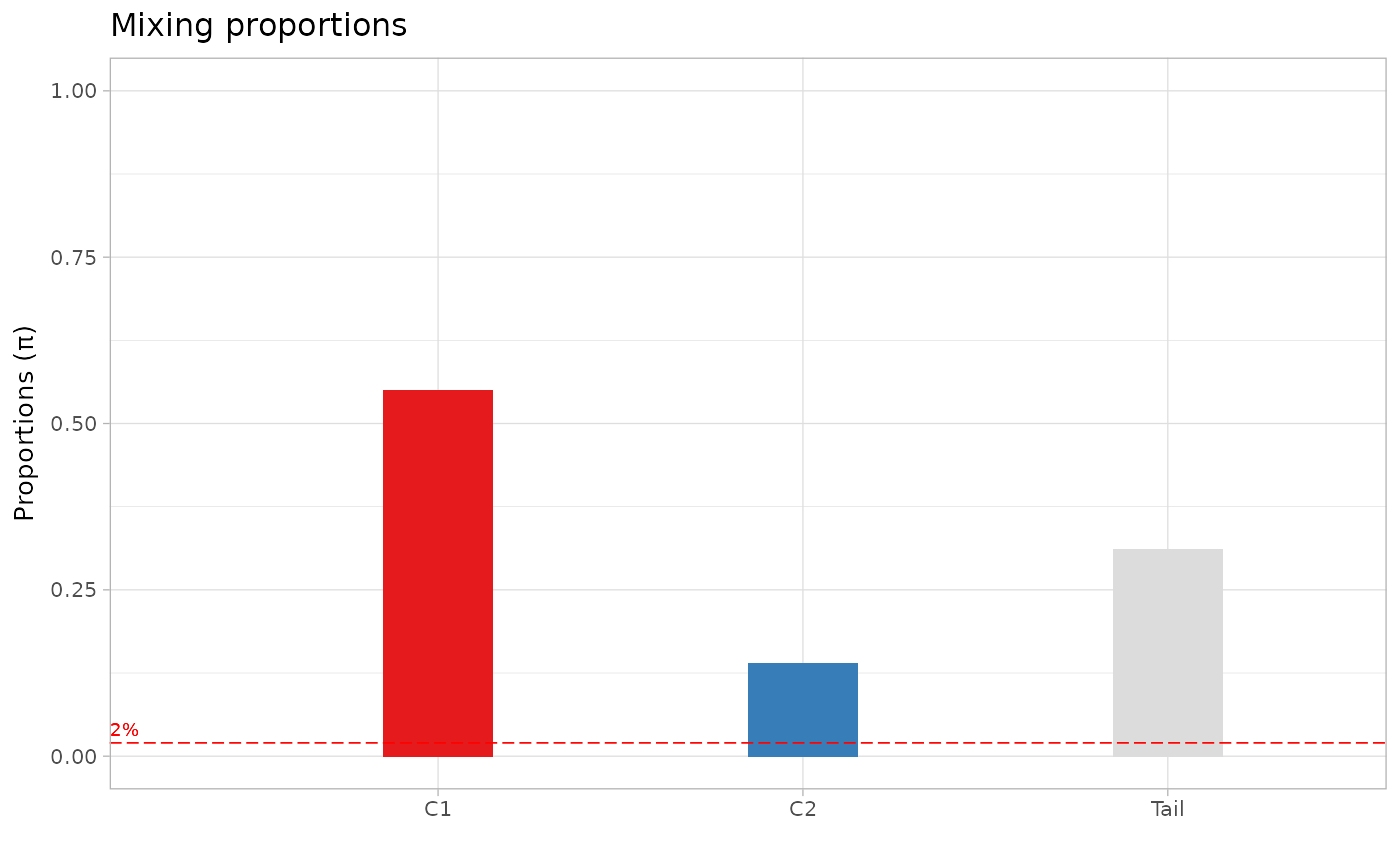
Plot the mixing proportions of the mixture.
Source:R/plot_mixing_proportions.R
plot_mixing_proportions.RdPlot the mixing proportions of the mixture.
Usage
plot_mixing_proportions(x, colors = c(Tail = "gainsboro"))Examples
data(fit_example)
plot_mixing_proportions(fit_example$best)
#> Warning: All aesthetics have length 1, but the data has 3 rows.
#> ℹ Please consider using `annotate()` or provide this layer with data containing
#>   a single row.
#> Warning: No shared levels found between `names(values)` of the manual scale and the
#> data's colour values.