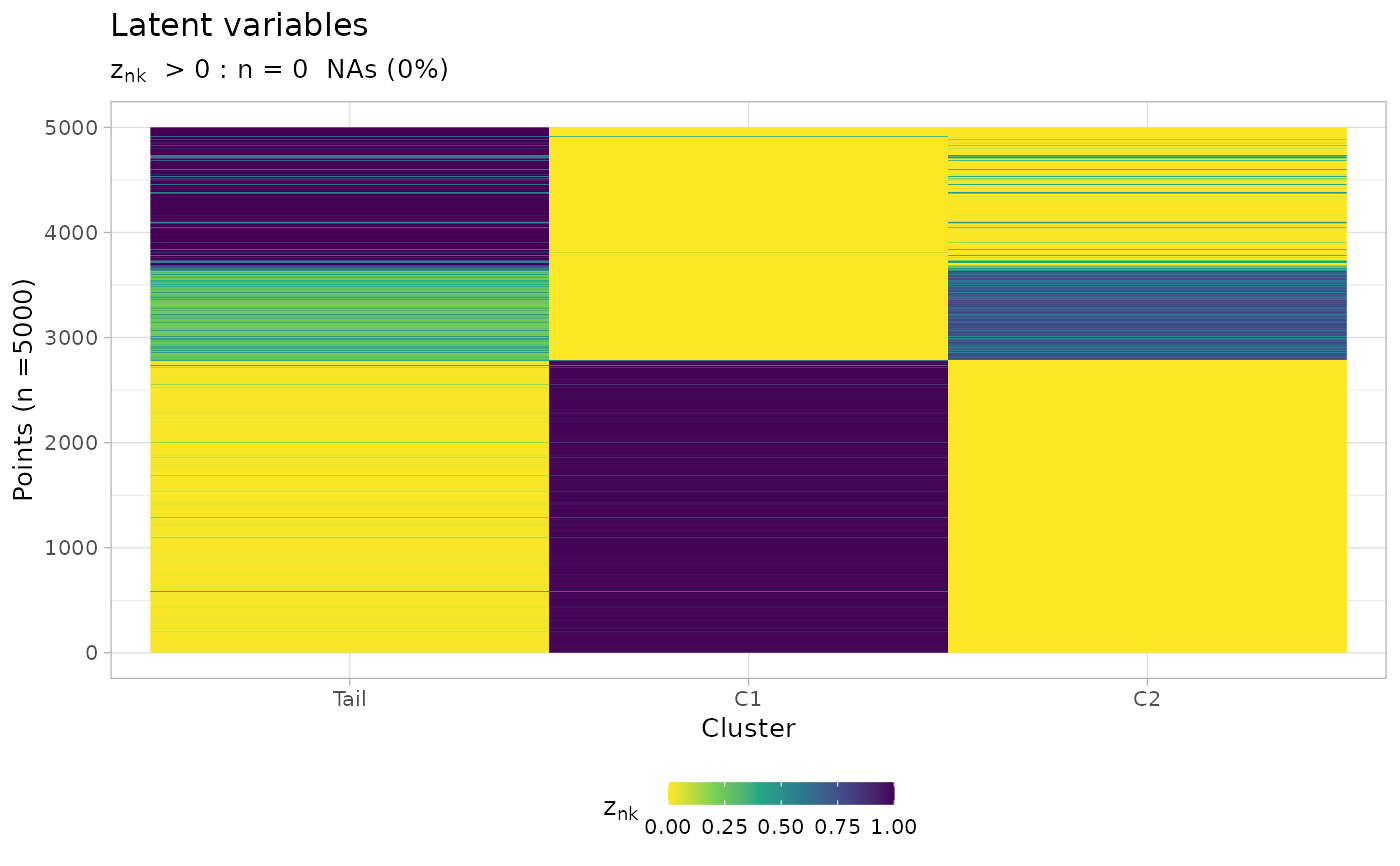
Plot the latent variables of the mixture.
Source:R/plot_latent_variables.R
plot_latent_variables.RdIt renders a heatmap where the latent variables
(reponsibilities) are shown and colured according to their value.
This function also calls function Clusters, using a parameter
that determines if a point is not to be assigned its best cluster
based on a cutoff.
Examples
data('fit_example', package = 'mobster')
plot_latent_variables(fit_example$best)

plot_latent_variables(fit_example$best, cutoff_assignment = .9)
