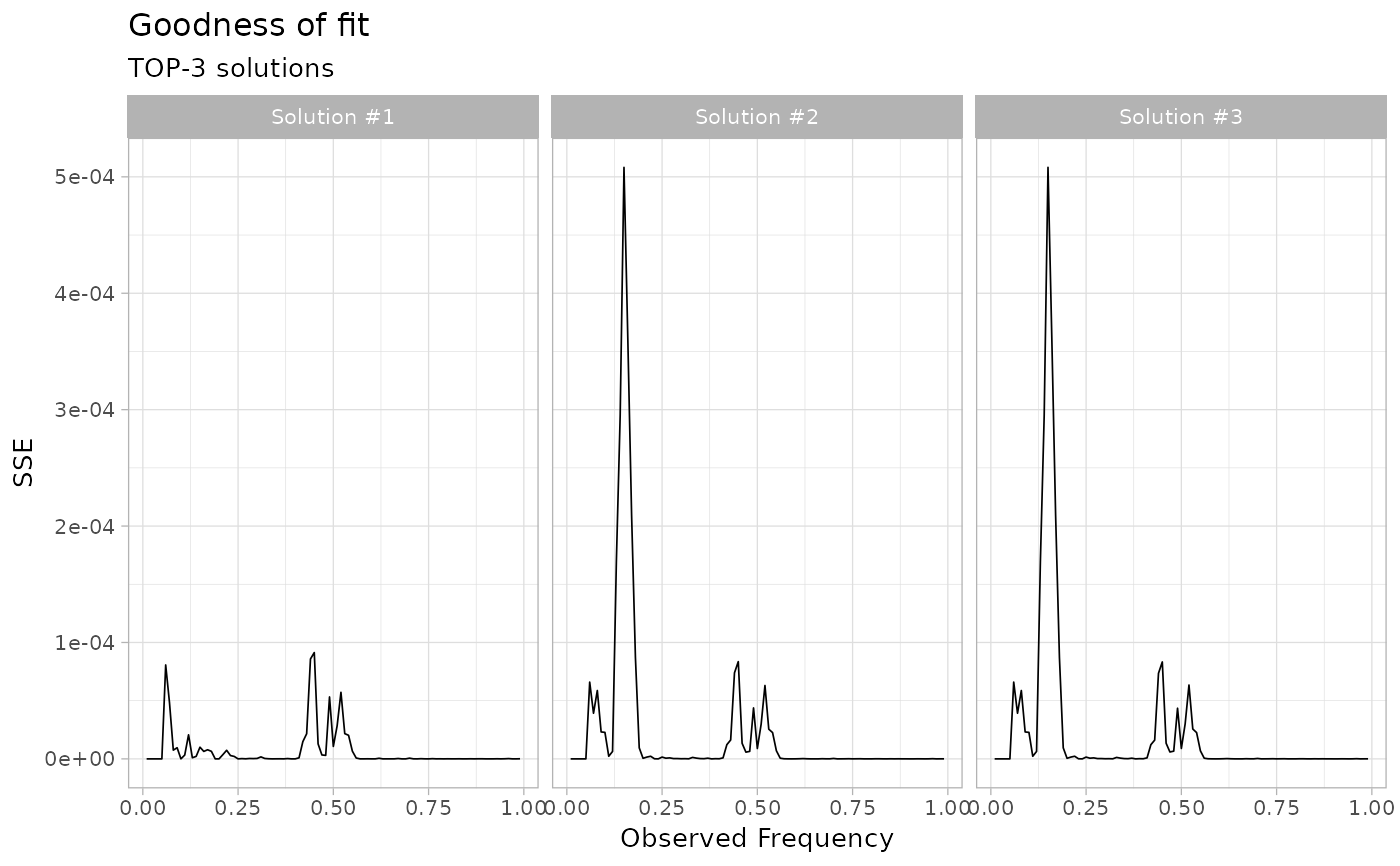
Plot the SSE (sum of squared error) as a proxy for the
goodness of fit. For the TOP available solutions the SSE trace is shown.
Examples
data('fit_example', package = 'mobster')
plot_gofit(fit_example, TOP = 3)
Plot the SSE (sum of squared error) as a proxy for the
goodness of fit. For the TOP available solutions the SSE trace is shown.
data('fit_example', package = 'mobster')
plot_gofit(fit_example, TOP = 3)