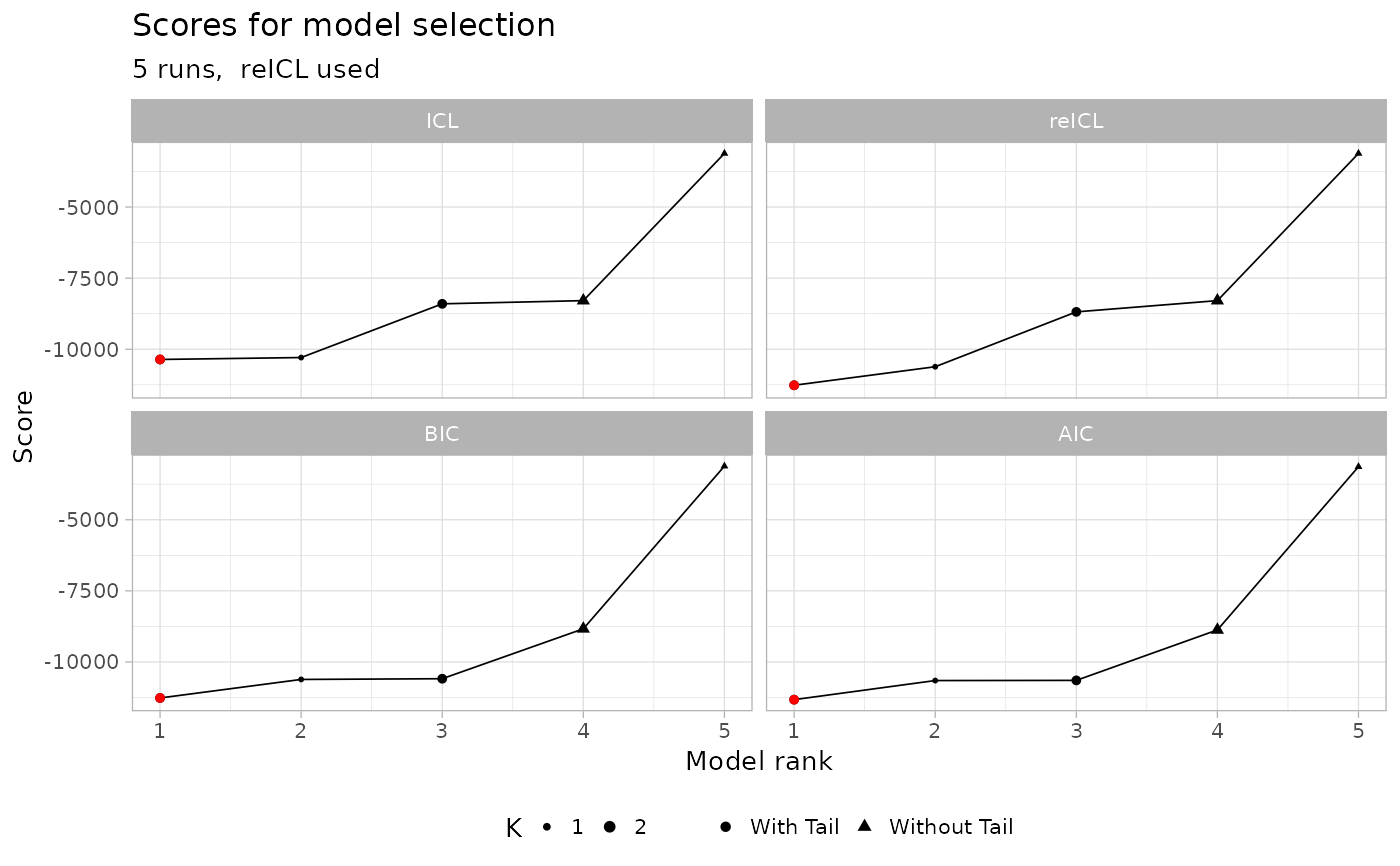
Plots the scores via ICL, reICL, BIC and AIC which can be used for model selection. It allows to easily see if the model selected as best is consistently better for all scores.
Examples
data('fit_example', package = 'mobster')
plot_fit_scores(fit_example)