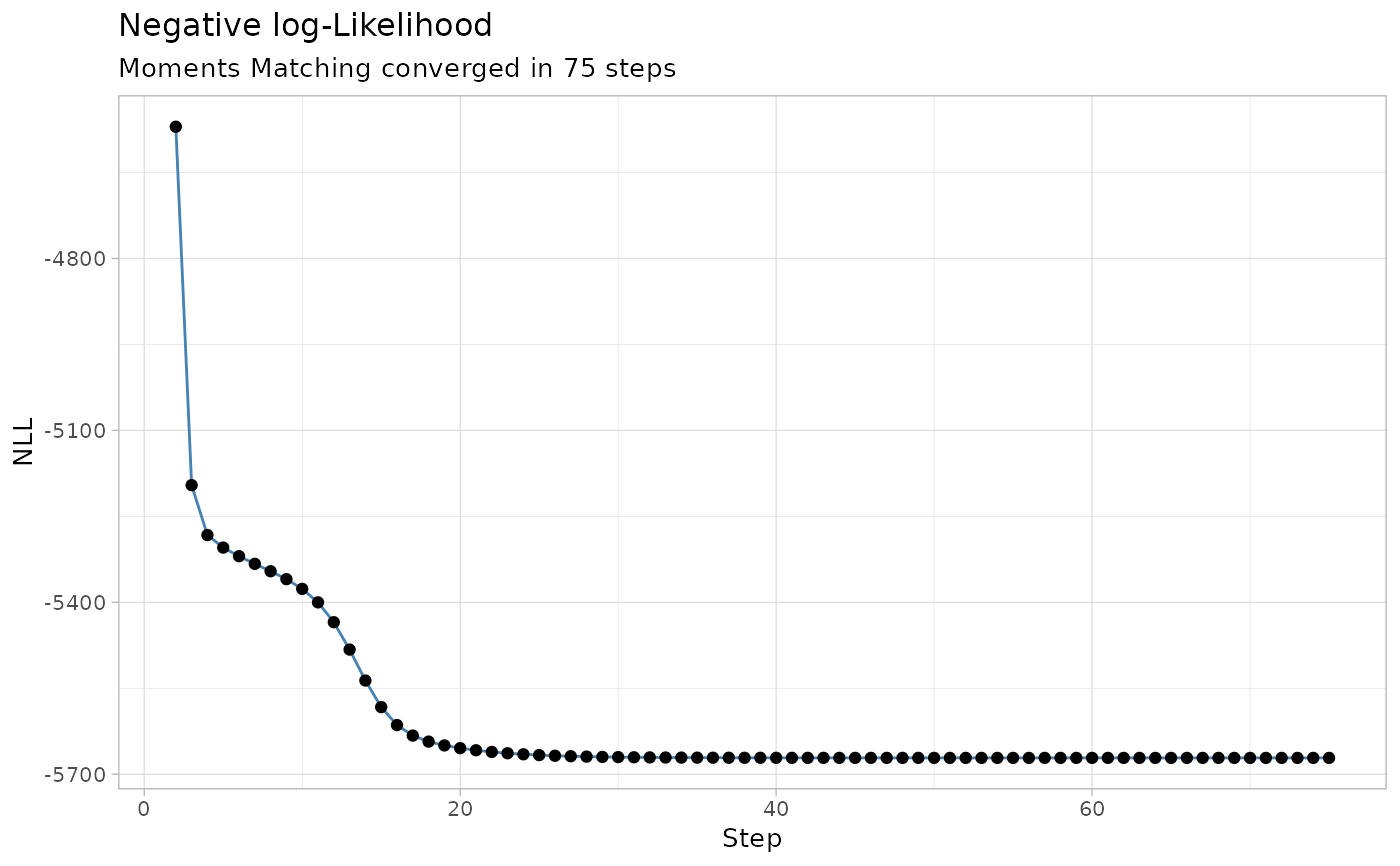
It plots the Negative log-Likelihood (NLL) trace of a fit.
Examples
data('fit_example', package = 'mobster')
plot_NLL(fit_example$best)
It plots the Negative log-Likelihood (NLL) trace of a fit.
data('fit_example', package = 'mobster')
plot_NLL(fit_example$best)