Data from an example MOBSTER fit; this object is the result of running `mobster_fit` function on the input dat.a The ouput is a list which contains the best fit, the top runs and a table summarising the fit scores. The input data has been simulated with a stochastic branching process model.
Usage
data(fit_example)Examples
data(fit_example)
print(fit_example$best)
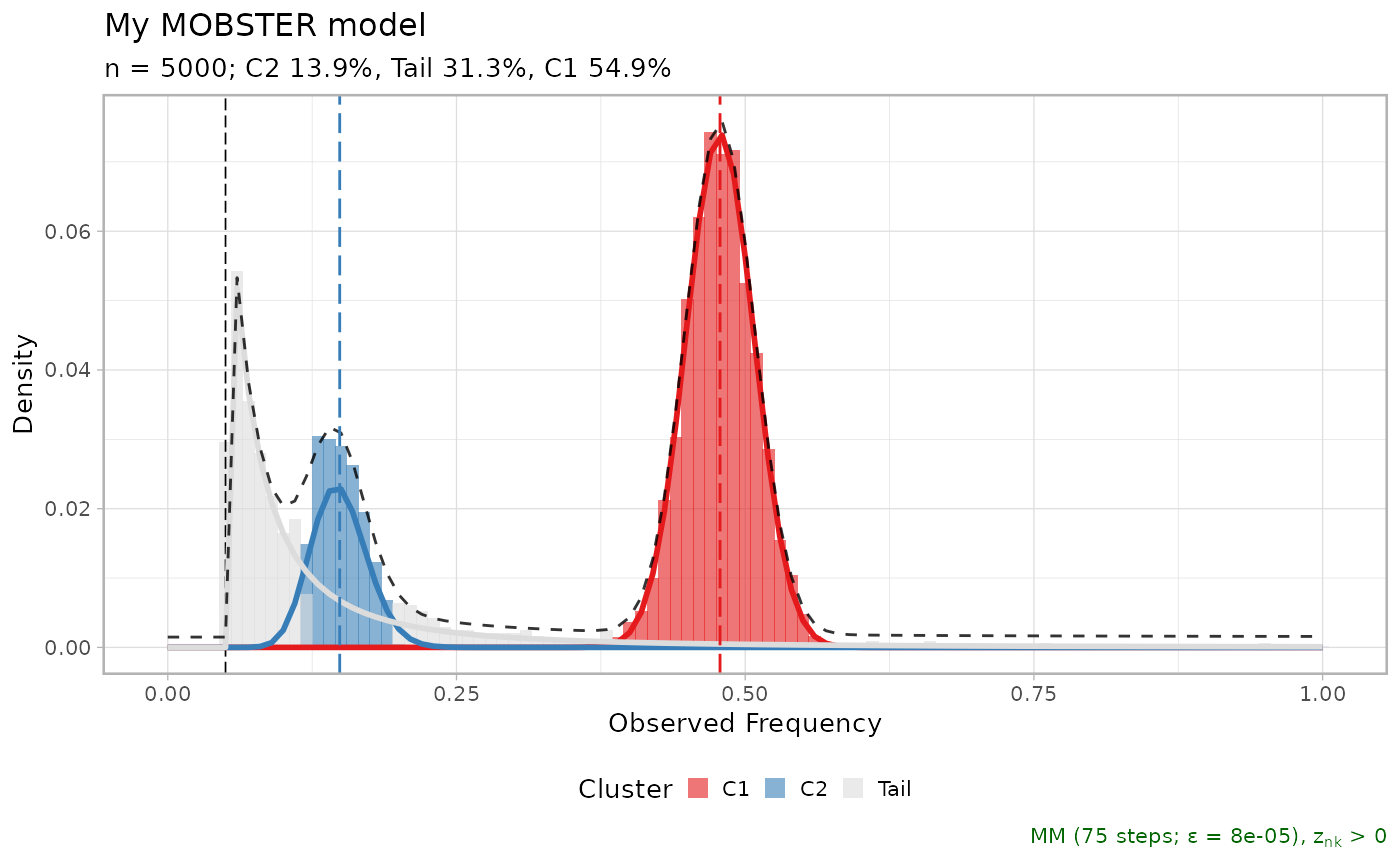
#> ── [ MOBSTER ] My MOBSTER model n = 5000 with k = 2 Beta(s) and a tail ─────────
#> ● Clusters: π = 55% [C1], 31% [Tail], and 14% [C2], with π > 0.
#> ● Tail [n = 1370, 31%] with alpha = 1.2.
#> ● Beta C1 [n = 2784, 55%] with mean = 0.48.
#> ● Beta C2 [n = 846, 14%] with mean = 0.15.
#> ℹ Score(s): NLL = -5671.5; ICL = -10359.09 (-11266.35), H = 907.26 (0). Fit
#> converged by MM in 75 steps.
plot(fit_example$best)