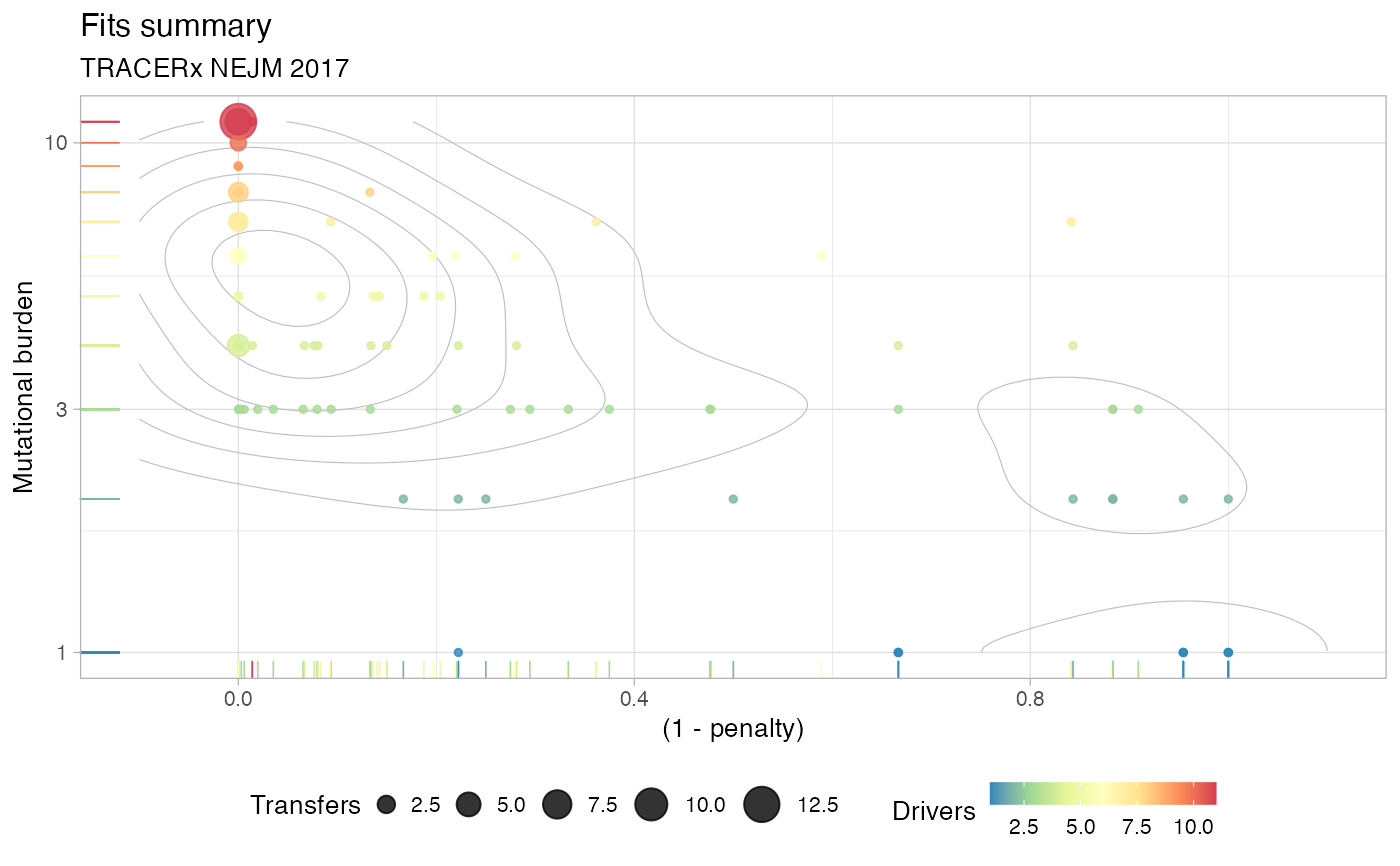
Summary scatterplot of a cohort's fits.
# S3 method for class 'rev_cohort_fit'
plot(x, ...)Value
A ggplot object of the plot.
Details
Returns a scatterplot of the penalty of a patient's best fit, versus the tumour mutational burden. Each dot is sized by the number of combinations of Information Transfer for a patient, and coloured by the number of annotated drivers.
See also
Other S3 functions:
plot.rev_cohort(),
print.rev_cohort(),
print.rev_cohort_fit()