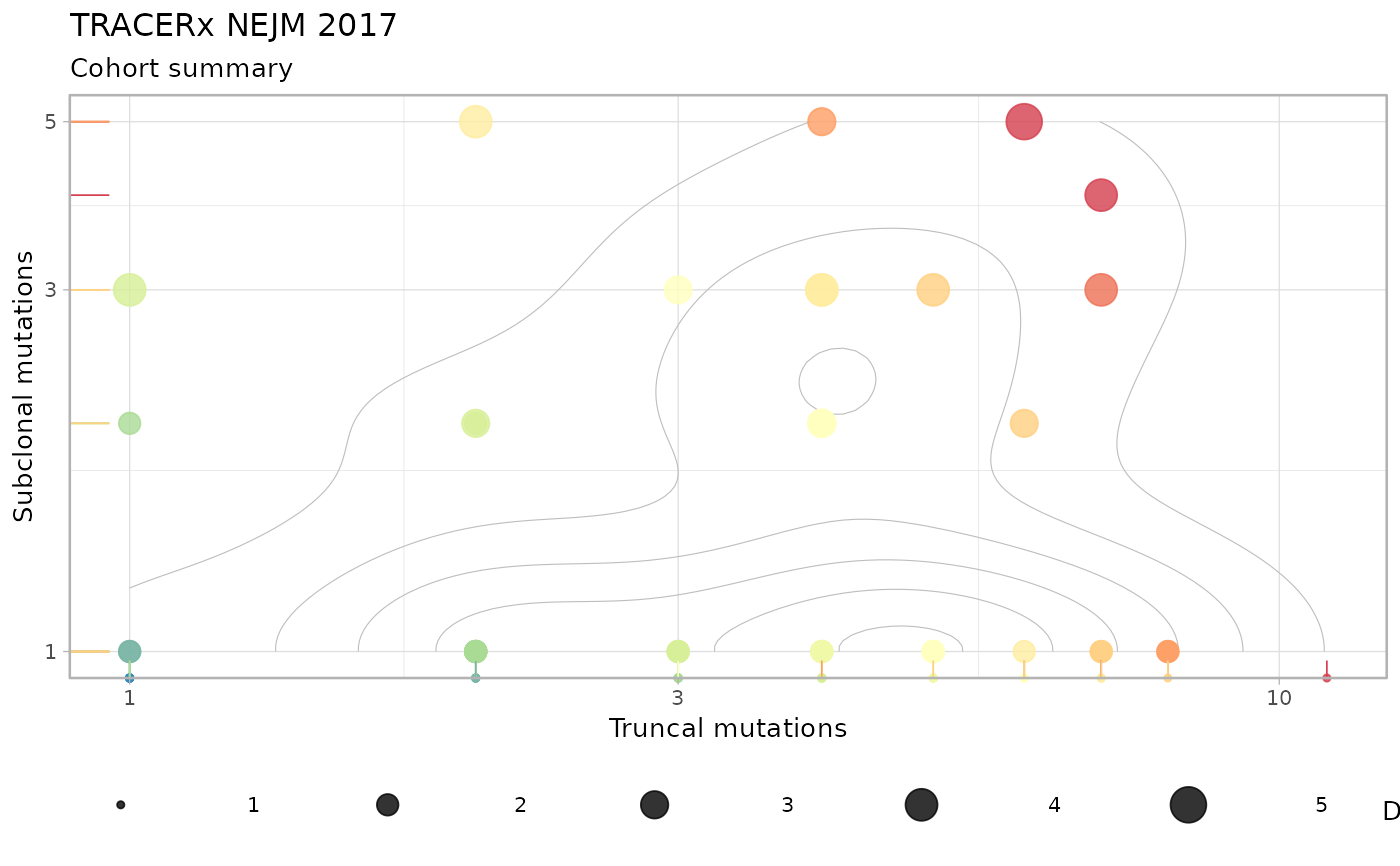
Summary scatterplot of a cohort.
# S3 method for class 'rev_cohort'
plot(x, ...)Value
A ggplot object of the plot.
Details
Returns a scatterplot of the tumour mutational burden, at the clonal and subclonal level. Each dot is sized by the number of clones with drivers, and coloured by the numnber of drivers.
See also
Other S3 functions:
plot.rev_cohort_fit(),
print.rev_cohort(),
print.rev_cohort_fit()
Examples
# Data released in the 'evoverse.datasets'
data('TRACERx_NEJM_2017_REVOLVER', package = 'evoverse.datasets')

# Downcast to rev_cohort to use this method (the loaded object is rev_cohort_fit)
x = TRACERx_NEJM_2017_REVOLVER
class(x) = 'rev_cohort'

plot(x)
#> Warning: Using `size` aesthetic for lines was deprecated in ggplot2 3.4.0.
#> ℹ Please use `linewidth` instead.
#> ℹ The deprecated feature was likely used in the revolver package.
#>   Please report the issue at <https://github.com/caravagnalab/revolver/issues>.
#> Warning: log-10 transformation introduced infinite values.
#> Warning: log-10 transformation introduced infinite values.
#> Warning: log-10 transformation introduced infinite values.
#> Warning: Removed 54 rows containing non-finite outside the scale range
#> (`stat_density2d()`).