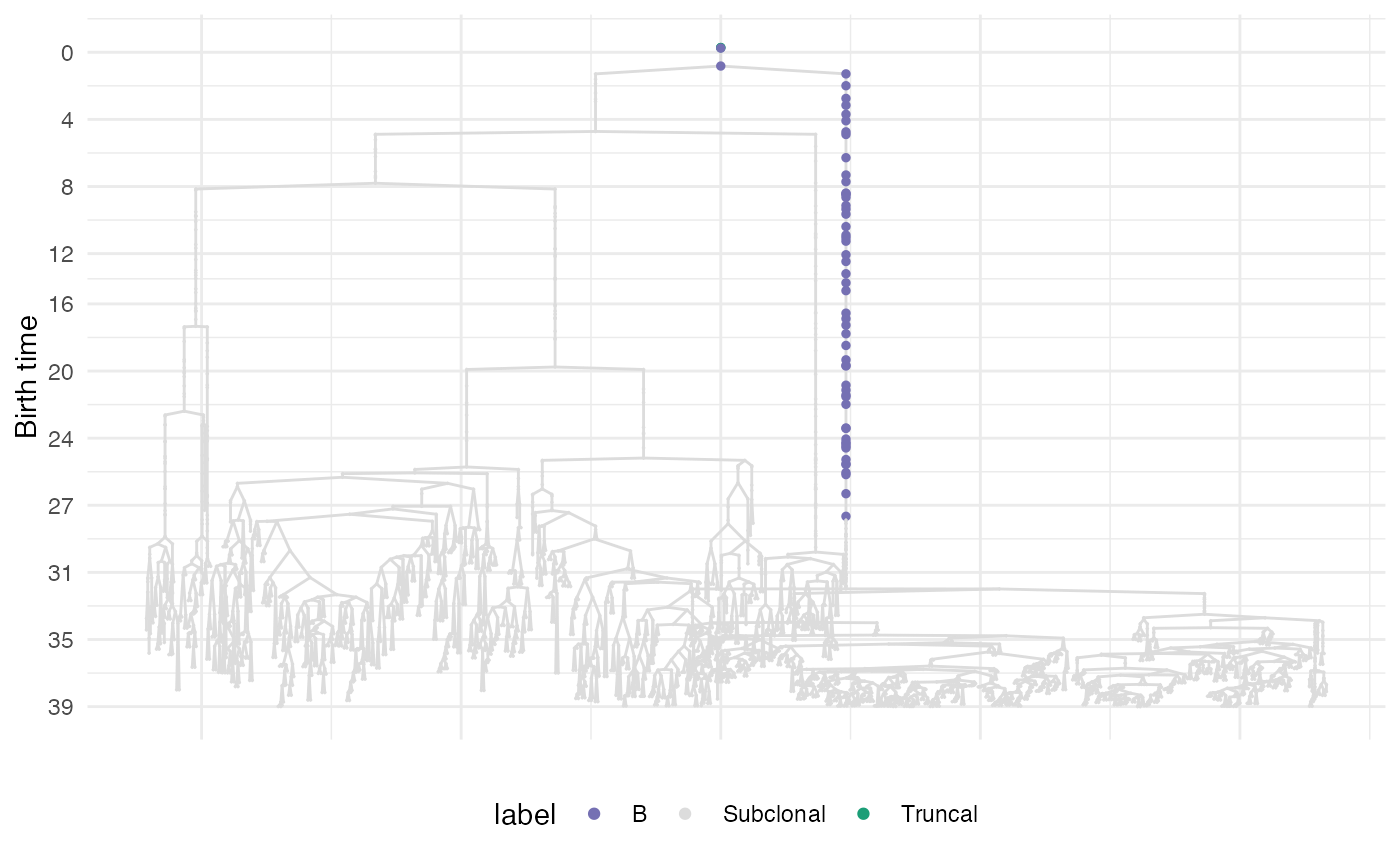
It annotates a plot of cell divisions where branches containing relevant biological events are colored
Arguments
- forest
The original forest object has been derived.
- labels
A data frame annotating the sticks (it can be the output of
get_relevant_branches()).- cls
A custom list of colors for any stick. If NULL a deafult palette is chosen.
Examples
sim <- SpatialSimulation()

sim$add_mutant(name = "A",
               growth_rates = 1,
               death_rates = 0)
sim$place_cell("A", 500, 500)
sim$run_up_to_size("A",1e4)
#>
 [████████████████████████████████████████] 100% [00m:00s] Saving snapshot


sim$add_mutant(name = "B",
               growth_rates = 3.5,
               death_rates = 0)
sim$mutate_progeny(sim$choose_cell_in("A"), "B")

sim$run_up_to_size("B",1e4)
#>
 [████████████████████████████████████████] 100% [00m:00s] Saving snapshot


bbox <- sim$search_sample(c("A" = 100,"B" = 100), 50, 50)
sim$sample_cells("Sampling", bbox$lower_corner, bbox$upper_corner)
forest = sim$get_samples_forest()

labels = get_relevant_branches(forest)
plot_sticks(forest, labels)