Plot the number of observed trajectories in each cluster.
Source:R/plot_trajectories_per_clusters.R
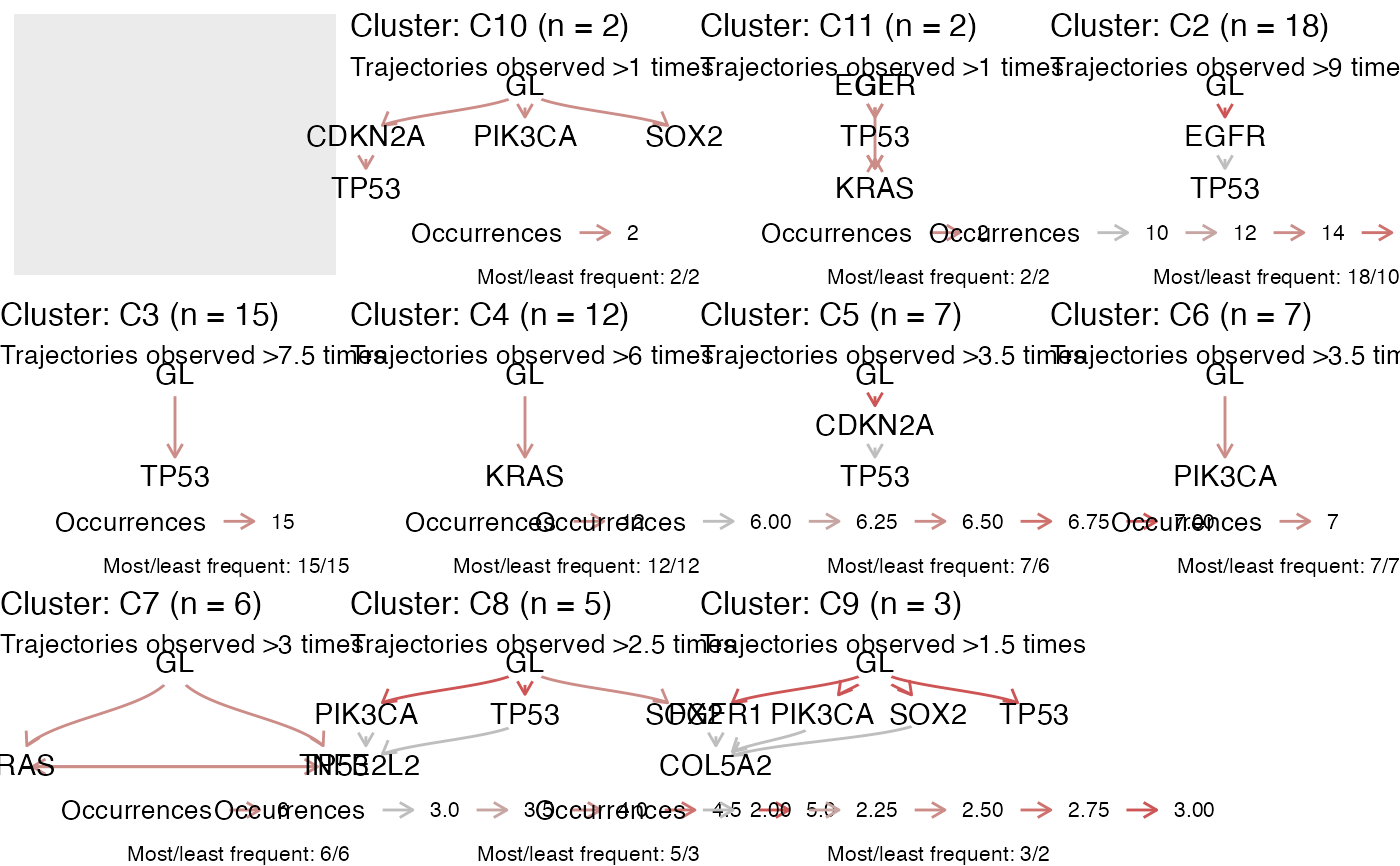
plot_trajectories_per_cluster.RdAssemble a figure that plots a graph (or tree) per cluster where each driver is connected to its trajectories. This allows to determine the most frequent trajectories in a cluster.
plot_trajectories_per_cluster(x, min_counts = 5)Arguments
Value
A figure with multiple plots.
Examples
# Data released in the 'evoverse.datasets'
data('TRACERx_NEJM_2017_REVOLVER', package = 'evoverse.datasets')

# In at least 5 cases
plot_trajectories_per_cluster(TRACERx_NEJM_2017_REVOLVER, min_counts = 5)


# In 50% of the cluster's cases
plot_trajectories_per_cluster(TRACERx_NEJM_2017_REVOLVER, min_counts = .5)
#> → min_counts in [0,1], interpreting that as a proportion.
#> → min_counts in [0,1], interpreting that as a proportion.
#> → min_counts in [0,1], interpreting that as a proportion.
#> → min_counts in [0,1], interpreting that as a proportion.
#> → min_counts in [0,1], interpreting that as a proportion.
#> → min_counts in [0,1], interpreting that as a proportion.
#> → min_counts in [0,1], interpreting that as a proportion.
#> → min_counts in [0,1], interpreting that as a proportion.
#> → min_counts in [0,1], interpreting that as a proportion.
#> → min_counts in [0,1], interpreting that as a proportion.
#> → min_counts in [0,1], interpreting that as a proportion.