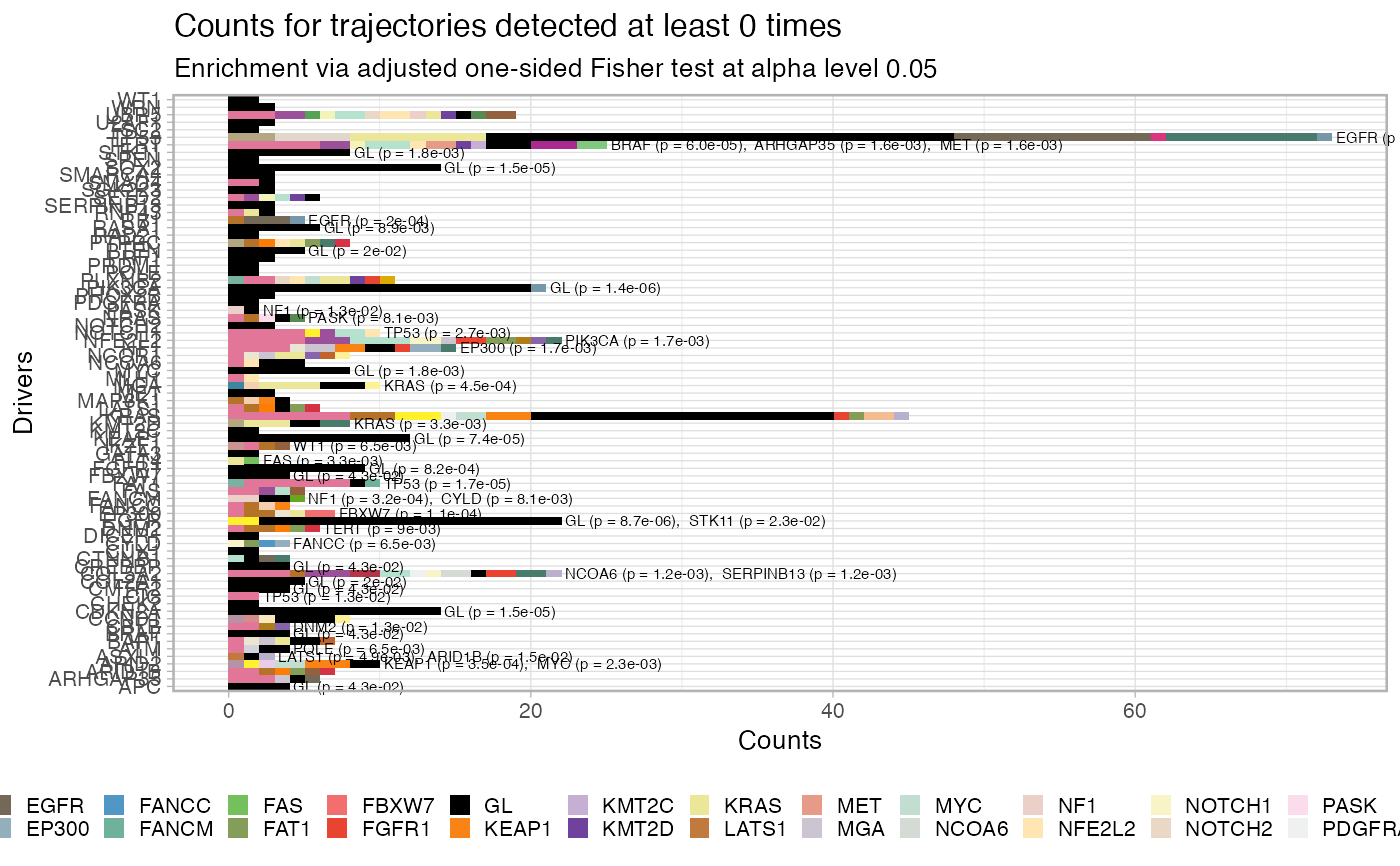
Plot the fit penalty as a barplot, for each one of a set of desired
driver events, where the bar represents the counts of each trajectory
in the data. This function allows also to filter out entries that have
been seen below a predetermined cutoff, and tests for significance in the
association A -> B via a one-sided Fisher 2x2 test adjusted for the number of
comparison (marginal count of B-ended trajectories). The tests are carried
out by function revolver:::enrichment_test_incoming_edge, which can
be used to obtain a tidy representation of the tests' results.
plot_penalty(
  x,
  drivers = x$variantIDs.driver,
  min.occurrences = 0,
  alpha_level = 0.05,
  drivers_palette = distinct_palette_many
)
Arguments
- x
A REVOLVER object with fits.
- drivers
The list of drivers to use; by default all of them. If the entry is a subset of the actual list of all drivers, all the entries in the penalty data structure
x$fit$penaltywill be used if they involve at least one event fromdrivers.- min.occurrences
The penalty data structure will be filtered for
countvalues above this threshold.- alpha_level
The significance level for the enrichment Fisher test.
- drivers_palette
A function that can return, for an input number, a number of colours.
Value
A ggplot object for this plot.
Examples
# Data released in the 'evoverse.datasets'
data('TRACERx_NEJM_2017_REVOLVER', package = 'evoverse.datasets')
plot_penalty(TRACERx_NEJM_2017_REVOLVER)
#>
#> =-=-=-=-=-=-=-=-=-=-=-=-=-=-=-=-=-=-
#> Enrichment test for incoming edges
#> =-=-=-=-=-=-=-=-=-=-=-=-=-=-=-=-=-=-
#> # A tibble: 49 × 15
#> estimate p.value conf.low conf.high method alternative from to POS_POS
#> <dbl> <dbl> <dbl> <dbl> <chr> <chr> <chr> <chr> <int>
#> 1 23.0 1.82e-9 8.60 Inf Fishe… greater EGFR TP53 13
#> 2 25.4 1.36e-6 4.81 Inf Fishe… greater GL PIK3… 20
#> 3 10.5 6.27e-6 4.19 Inf Fishe… greater CDKN… TP53 10
#> 4 12.6 8.68e-6 3.56 Inf Fishe… greater GL EGFR 20
#> 5 Inf 1.48e-5 5.16 Inf Fishe… greater GL CDKN… 14
#> 6 Inf 1.48e-5 5.16 Inf Fishe… greater GL SOX2 14
#> 7 19.8 1.71e-5 5.37 Inf Fishe… greater TP53 FAT1 7
#> 8 Inf 2.10e-5 9.42 Inf Fishe… greater RASA1 TP53 5
#> 9 Inf 5.99e-5 14.5 Inf Fishe… greater BRAF TERT 3
#> 10 Inf 7.41e-5 4.31 Inf Fishe… greater GL KEAP1 12
#> # ℹ 39 more rows
#> # ℹ 6 more variables: POS_NEG <int>, NEG_POS <int>, NEG_NEG <int>,
#> # alpha_level <dbl>, N <int>, psign <lgl>
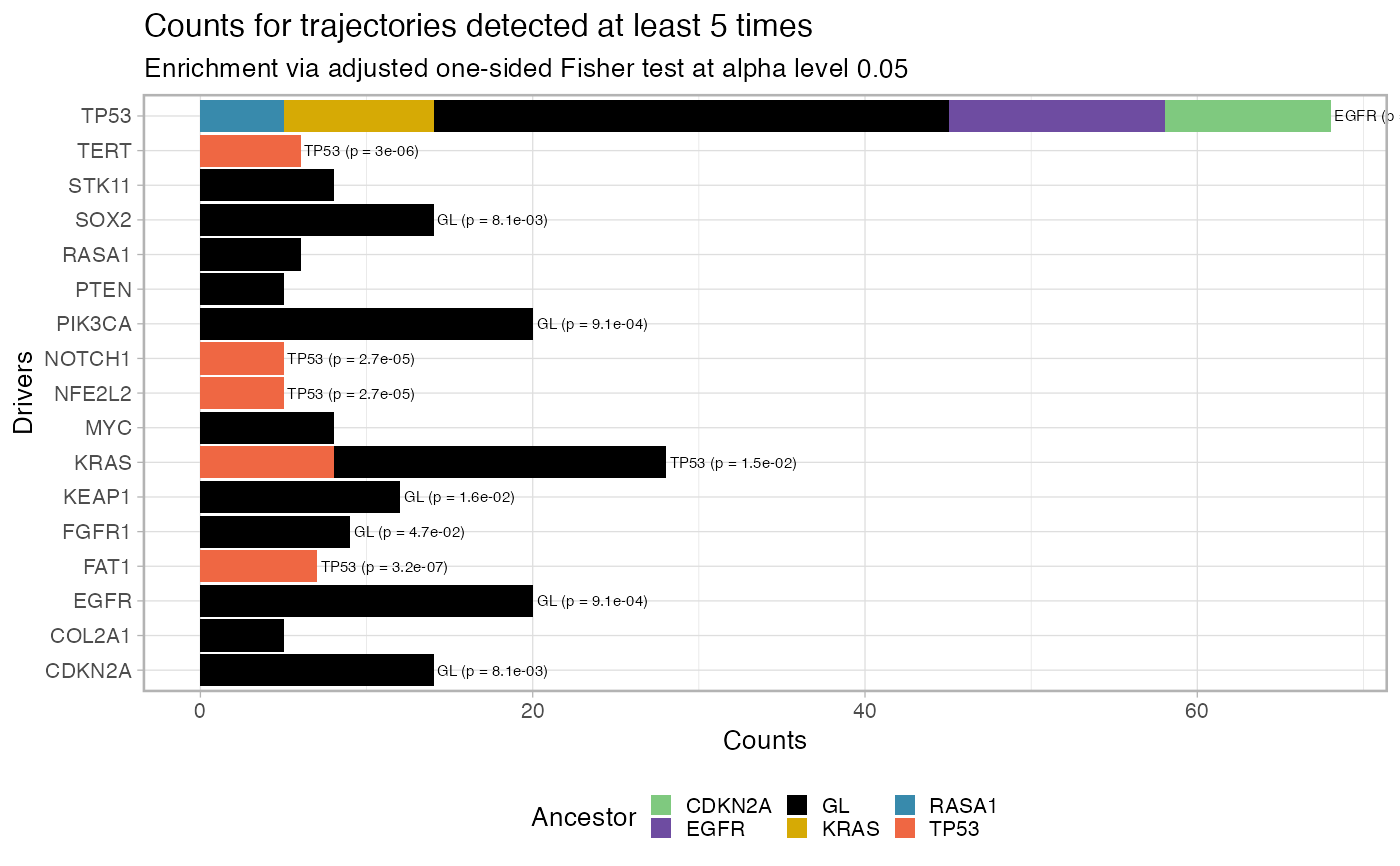
 plot_penalty(TRACERx_NEJM_2017_REVOLVER, min.occurrences = 5)
#>
#> =-=-=-=-=-=-=-=-=-=-=-=-=-=-=-=-=-=-
#> Enrichment test for incoming edges
#> =-=-=-=-=-=-=-=-=-=-=-=-=-=-=-=-=-=-
#> # A tibble: 15 × 15
#> estimate p.value conf.low conf.high method alternative from to POS_POS
#> <dbl> <dbl> <dbl> <dbl> <chr> <chr> <chr> <chr> <int>
#> 1 Inf 3.10e-8 11.5 Inf Fishe… greater EGFR TP53 13
#> 2 Inf 3.16e-7 15.0 Inf Fishe… greater TP53 FAT1 7
#> 3 Inf 2.01e-6 8.13 Inf Fishe… greater CDKN… TP53 10
#> 4 Inf 2.95e-6 11.9 Inf Fishe… greater TP53 TERT 6
#> 5 Inf 7.88e-6 7.08 Inf Fishe… greater KRAS TP53 9
#> 6 Inf 2.67e-5 9.10 Inf Fishe… greater TP53 NFE2… 5
#> 7 Inf 2.67e-5 9.10 Inf Fishe… greater TP53 NOTC… 5
#> 8 Inf 9.14e-4 2.67 Inf Fishe… greater GL EGFR 20
#> 9 Inf 9.14e-4 2.67 Inf Fishe… greater GL PIK3… 20
#> 10 Inf 1.64e-3 3.21 Inf Fishe… greater RASA1 TP53 5
#> 11 Inf 8.06e-3 1.75 Inf Fishe… greater GL CDKN… 14
#> 12 Inf 8.06e-3 1.75 Inf Fishe… greater GL SOX2 14
#> 13 3.26 1.52e-2 1.31 Inf Fishe… greater TP53 KRAS 8
#> 14 Inf 1.64e-2 1.45 Inf Fishe… greater GL KEAP1 12
#> 15 Inf 4.69e-2 1.03 Inf Fishe… greater GL FGFR1 9
#> # ℹ 6 more variables: POS_NEG <int>, NEG_POS <int>, NEG_NEG <int>,
#> # alpha_level <dbl>, N <int>, psign <lgl>
plot_penalty(TRACERx_NEJM_2017_REVOLVER, min.occurrences = 5)
#>
#> =-=-=-=-=-=-=-=-=-=-=-=-=-=-=-=-=-=-
#> Enrichment test for incoming edges
#> =-=-=-=-=-=-=-=-=-=-=-=-=-=-=-=-=-=-
#> # A tibble: 15 × 15
#> estimate p.value conf.low conf.high method alternative from to POS_POS
#> <dbl> <dbl> <dbl> <dbl> <chr> <chr> <chr> <chr> <int>
#> 1 Inf 3.10e-8 11.5 Inf Fishe… greater EGFR TP53 13
#> 2 Inf 3.16e-7 15.0 Inf Fishe… greater TP53 FAT1 7
#> 3 Inf 2.01e-6 8.13 Inf Fishe… greater CDKN… TP53 10
#> 4 Inf 2.95e-6 11.9 Inf Fishe… greater TP53 TERT 6
#> 5 Inf 7.88e-6 7.08 Inf Fishe… greater KRAS TP53 9
#> 6 Inf 2.67e-5 9.10 Inf Fishe… greater TP53 NFE2… 5
#> 7 Inf 2.67e-5 9.10 Inf Fishe… greater TP53 NOTC… 5
#> 8 Inf 9.14e-4 2.67 Inf Fishe… greater GL EGFR 20
#> 9 Inf 9.14e-4 2.67 Inf Fishe… greater GL PIK3… 20
#> 10 Inf 1.64e-3 3.21 Inf Fishe… greater RASA1 TP53 5
#> 11 Inf 8.06e-3 1.75 Inf Fishe… greater GL CDKN… 14
#> 12 Inf 8.06e-3 1.75 Inf Fishe… greater GL SOX2 14
#> 13 3.26 1.52e-2 1.31 Inf Fishe… greater TP53 KRAS 8
#> 14 Inf 1.64e-2 1.45 Inf Fishe… greater GL KEAP1 12
#> 15 Inf 4.69e-2 1.03 Inf Fishe… greater GL FGFR1 9
#> # ℹ 6 more variables: POS_NEG <int>, NEG_POS <int>, NEG_NEG <int>,
#> # alpha_level <dbl>, N <int>, psign <lgl>
 plot_penalty(TRACERx_NEJM_2017_REVOLVER, min.occurrences = 5, alpha_level = 0.001)
#>
#> =-=-=-=-=-=-=-=-=-=-=-=-=-=-=-=-=-=-
#> Enrichment test for incoming edges
#> =-=-=-=-=-=-=-=-=-=-=-=-=-=-=-=-=-=-
#> # A tibble: 9 × 15
#> estimate p.value conf.low conf.high method alternative from to POS_POS
#> <dbl> <dbl> <dbl> <dbl> <chr> <chr> <chr> <chr> <int>
#> 1 Inf 3.10e-8 11.5 Inf Fishe… greater EGFR TP53 13
#> 2 Inf 3.16e-7 15.0 Inf Fishe… greater TP53 FAT1 7
#> 3 Inf 2.01e-6 8.13 Inf Fishe… greater CDKN… TP53 10
#> 4 Inf 2.95e-6 11.9 Inf Fishe… greater TP53 TERT 6
#> 5 Inf 7.88e-6 7.08 Inf Fishe… greater KRAS TP53 9
#> 6 Inf 2.67e-5 9.10 Inf Fishe… greater TP53 NFE2… 5
#> 7 Inf 2.67e-5 9.10 Inf Fishe… greater TP53 NOTC… 5
#> 8 Inf 9.14e-4 2.67 Inf Fishe… greater GL EGFR 20
#> 9 Inf 9.14e-4 2.67 Inf Fishe… greater GL PIK3… 20
#> # ℹ 6 more variables: POS_NEG <int>, NEG_POS <int>, NEG_NEG <int>,
#> # alpha_level <dbl>, N <int>, psign <lgl>
plot_penalty(TRACERx_NEJM_2017_REVOLVER, min.occurrences = 5, alpha_level = 0.001)
#>
#> =-=-=-=-=-=-=-=-=-=-=-=-=-=-=-=-=-=-
#> Enrichment test for incoming edges
#> =-=-=-=-=-=-=-=-=-=-=-=-=-=-=-=-=-=-
#> # A tibble: 9 × 15
#> estimate p.value conf.low conf.high method alternative from to POS_POS
#> <dbl> <dbl> <dbl> <dbl> <chr> <chr> <chr> <chr> <int>
#> 1 Inf 3.10e-8 11.5 Inf Fishe… greater EGFR TP53 13
#> 2 Inf 3.16e-7 15.0 Inf Fishe… greater TP53 FAT1 7
#> 3 Inf 2.01e-6 8.13 Inf Fishe… greater CDKN… TP53 10
#> 4 Inf 2.95e-6 11.9 Inf Fishe… greater TP53 TERT 6
#> 5 Inf 7.88e-6 7.08 Inf Fishe… greater KRAS TP53 9
#> 6 Inf 2.67e-5 9.10 Inf Fishe… greater TP53 NFE2… 5
#> 7 Inf 2.67e-5 9.10 Inf Fishe… greater TP53 NOTC… 5
#> 8 Inf 9.14e-4 2.67 Inf Fishe… greater GL EGFR 20
#> 9 Inf 9.14e-4 2.67 Inf Fishe… greater GL PIK3… 20
#> # ℹ 6 more variables: POS_NEG <int>, NEG_POS <int>, NEG_NEG <int>,
#> # alpha_level <dbl>, N <int>, psign <lgl>
