This function is like plot_data, as it uses base plotting
functions to assemble a summary plot for a patient. This function
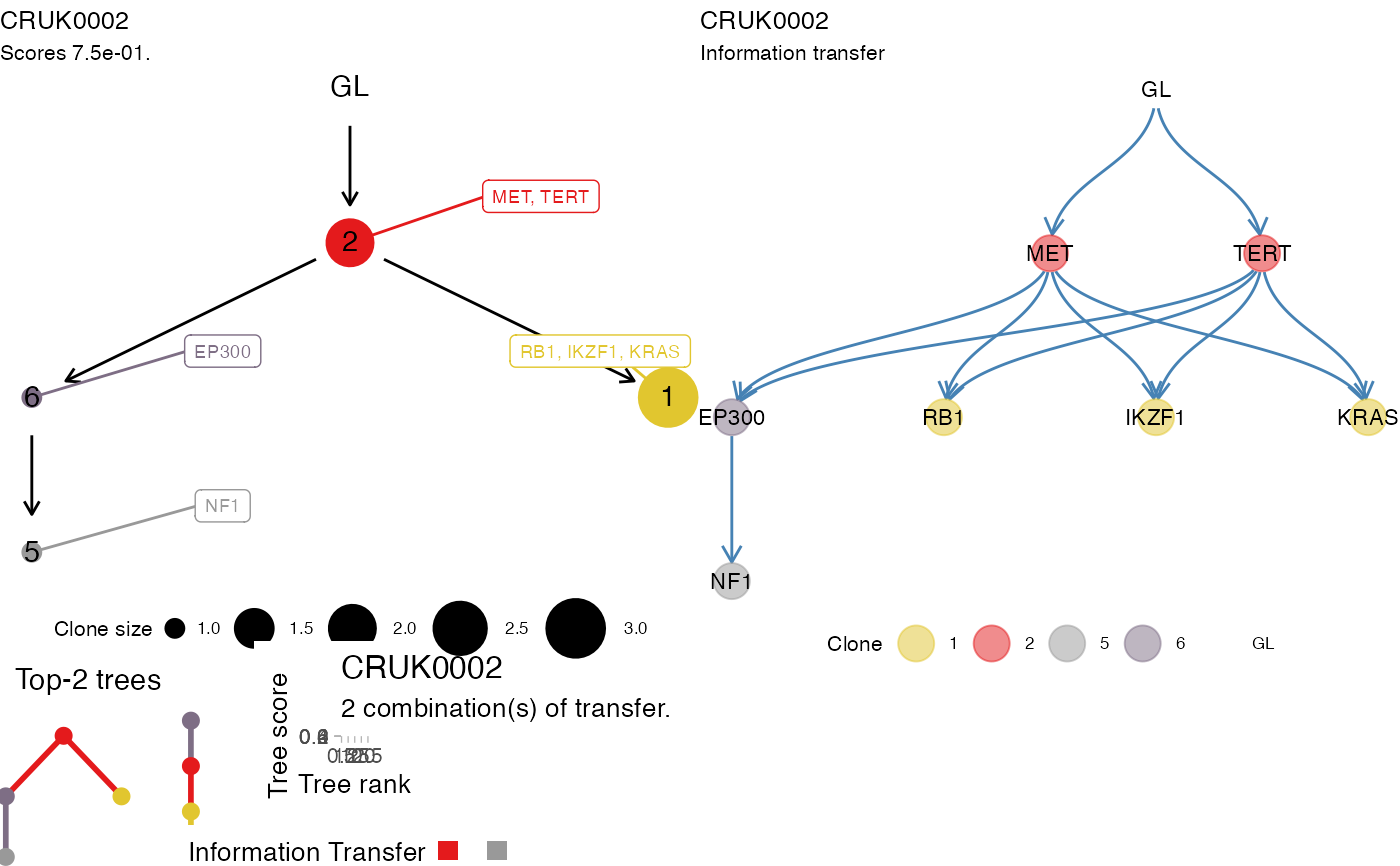
assembled the plot via ggpubr. The first line of plots
represents the top tree for a patient, and its information transfer.
The strip below represents up to the top-10 trees for this patient,
as they are obtained from the standard tree-scoring (which means
that the score is not accounting for the actual transfer, but just
for the tree structure).
plot_patient_trees(x, patient, ...)Arguments
Value
A figure assembled with ggpubr.
Examples
# Data released in the 'evoverse.datasets'
data('TRACERx_NEJM_2017_REVOLVER', package = 'evoverse.datasets')

# This returns a figure assembled with ggpubr
plot_patient_trees(TRACERx_NEJM_2017_REVOLVER, patient = 'CRUK0002')
#> This graph was created by an old(er) igraph version.
#> ℹ Call `igraph::upgrade_graph()` on it to use with the current igraph version.
#> For now we convert it on the fly...
#> This graph was created by an old(er) igraph version.
#> ℹ Call `igraph::upgrade_graph()` on it to use with the current igraph version.
#> For now we convert it on the fly...
#> Warning: The `<scale>` argument of `guides()` cannot be `FALSE`. Use "none" instead as
#> of ggplot2 3.3.4.
#> ℹ The deprecated feature was likely used in the revolver package.
#>   Please report the issue at <https://github.com/caravagnalab/revolver/issues>.