To run the fit you need 2 tibbles (or matrices), with equal dimensions and matched column names. One tibble contains the counts of the successful Bernoulli trials, the other contains the count of all the attempted trials.
In the package we provide mvbmm_example, a dataset which
shows the input format.
data("mvbmm_example")The format is (S1 and S2 are the
dimensions)
mvbmm_example$successes
#> # A tibble: 231 × 2
#>       S1    S2
#>    <dbl> <dbl>
#>  1    44    39
#>  2    38    57
#>  3    45    54
#>  4    56    56
#>  5    54    56
#>  6    60    44
#>  7    53    46
#>  8    53    55
#>  9    56    53
#> 10    53    60
#> # ℹ 221 more rows
Fitting the model
You can fit the model with the variational_fit function,
which is quite well documented
??variational_fitYou have control over several parameters. Concerning the mixture type you can set the following
-
K, the maximum number of clusters returned -
alpha_0, the concentration parameter of the Dirichlet mixture. -
a_0andb_0, the prior Beta hyperparameter for each Binomial component
Concerning the variational optimization you can set the following
-
max_iter, the maximum number of fit iterations -
epsilon_conv, the epsilon to measure convergence as ELBO absolute difference -
samples, the number of fits computed.
The fitting engine makes use of the easypar package to run in
parallel the required number of fits. The default is multi-core
implementation that uses 80% of the available cores; you can disable
parallel runs and execute sequential turning off easypar,
as explained in its Wiki.
We run the fit with default parameters, the output model is print to screen.
fit = variational_fit(
mvbmm_example$successes,
mvbmm_example$trials
)
#> [ VIBER - variational fit ]
#>
#> ℹ Input n = 231, with k < 10. Dirichlet concentration α = 1e-06.
#> ℹ Beta (a_0, b_0) = (1, 1); q_i = prior. Optimise: ε = 1e-10 or 5000 steps, r = 10 starts.
#> ✔ VIBER fit completed in 0.04 mins (status: converged)
#> ── [ VIBER ] My VIBER model n = 231 (w = 2 dimensions). Fit with k = 10 clusters
#> • Clusters: π = 45% [C1], 28% [C6], 20% [C10], and 7% [C5], with π > 0.
#> • Binomials: θ = <0.5, 0.49> [C1], <0, 0.2> [C6], <0.25, 0.25> [C10], and
#> <0.22, 0> [C5].
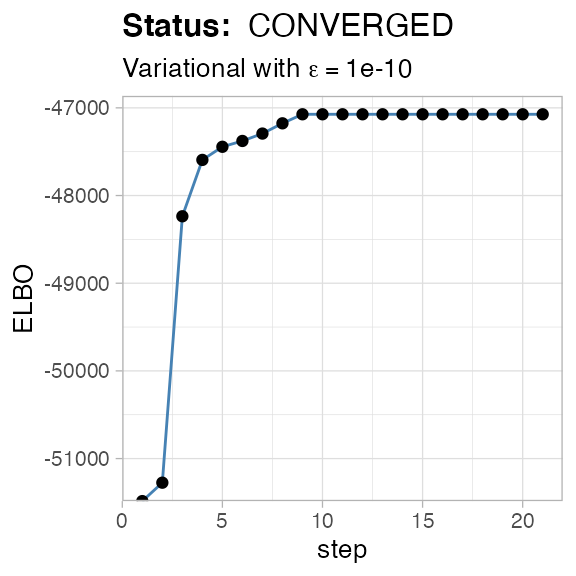
#> ℹ Score(s): ELBO = -47073.314. Fit converged in 19 steps, ε = 1e-10.Filtering output clusters
Because the model is semi-parametric, it will attempt to use at most
K Binomial clusters. However, most of those clusters might
be not interesting and you might want to filter them.
VIBER implements 2 possible filters which are available in function
choose_clusters.
- Filter 1 [F1] uses the cluster size (mixing proportion), which one can be required to be above a certain cutoff;
- Filter 2 [F2] the Binomial peaks, which one can ask to be above a certain value (e.g., ) in at least a certain number of dimensions.
Adter filtering, output clusters will be renamed by size (C1 will be larger etc.), and the latent variables and hard clustering assignments will be updated accordingly.
Here we require only the minimum cluster size to be 2% of the total number of points.
fit = choose_clusters(fit,
binomial_cutoff = 0,
dimensions_cutoff = 0,
pi_cutoff = 0.02)
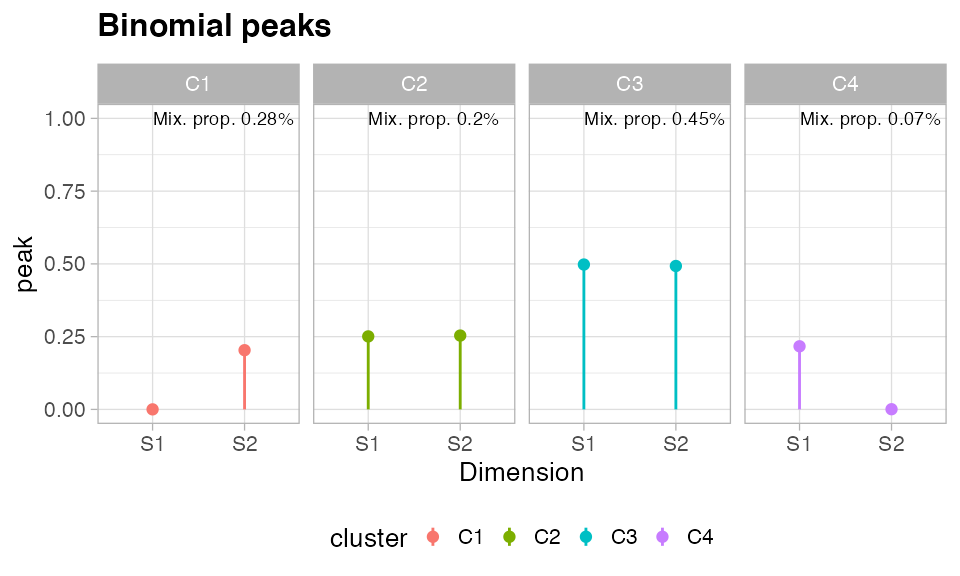
#> ✔ Reduced to k = 4 (from 10) selecting VIBER cluster(s) with π > 0.02, and Binomial p > 0 in w > 0 dimension(s).The new model has fewer clusters
fit
#> ── [ VIBER ] My VIBER model n = 231 (w = 2 dimensions). Fit with k = 4 clusters.
#> • Clusters: π = 45% [C1], 28% [C3], 20% [C4], and 7% [C2], with π > 0.
#> • Binomials: θ = <0.5, 0.49> [C1], <0, 0.2> [C3], <0.25, 0.25> [C4], and <0.22,
#> 0> [C2].
#> ℹ Score(s): ELBO = -47073.314. Fit converged in 19 steps, ε = 1e-10.
Renaming output clusters
Fit clusters can be renamed upon defining a named vector whose values are the newly desired names, and whose names are the names to change. This can help if certain clusters can be given a certain interpretation which we want to communicate through plots.
# rename 6 clusters as new_C_1, new_C_2, ....
new_labels = paste0("new_C_", 1:6)
names(new_labels) = paste0("C", 1:6)

print(new_labels)
#>        C1        C2        C3        C4        C5        C6
#> "new_C_1" "new_C_2" "new_C_3" "new_C_4" "new_C_5" "new_C_6"

# renaming
fit_renamed = rename_clusters(fit, new_labels)
#>
#> ── Renaming VIBER clusters C1, C2, C3, and C4 for the input object. ────────────
#> ── [ VIBER ] My VIBER model n = 231 (w = 2 dimensions). Fit with k = 4 clusters.
#> • Clusters: π = 45% [C1], 28% [C3], 20% [C4], and 7% [C2], with π > 0.
#> • Binomials: θ = <0.5, 0.49> [C1], <0, 0.2> [C3], <0.25, 0.25> [C4], and <0.22,
#> 0> [C2].
#> ℹ Score(s): ELBO = -47073.314. Fit converged in 19 steps, ε = 1e-10.
#> ! Names C5 and C6 are not going to be used because does not appear in the input object.
#>
#> ── Renaming map
#>
#>   C1 -> new_C_1
#>   C2 -> new_C_2
#>   C3 -> new_C_3
#>   C4 -> new_C_4
#>
#> ── Renamed VIBER object
#> ── [ VIBER ] My VIBER model n = 231 (w = 2 dimensions). Fit with k = 4 clusters.
#> • Clusters: π = 45% [new_C_1], 28% [new_C_3], 20% [new_C_4], and 7% [new_C_2],
#> with π > 0.
#> • Binomials: θ = <0.5, 0.49> [new_C_1], <0, 0.2> [new_C_3], <0.25, 0.25>
#> [new_C_4], and <0.22, 0> [new_C_2].
#> ℹ Score(s): ELBO = -47073.314. Fit converged in 19 steps, ε = 1e-10.
print(fit_renamed)
#> ── [ VIBER ] My VIBER model n = 231 (w = 2 dimensions). Fit with k = 4 clusters.
#> • Clusters: π = 45% [new_C_1], 28% [new_C_3], 20% [new_C_4], and 7% [new_C_2],
#> with π > 0.
#> • Binomials: θ = <0.5, 0.49> [new_C_1], <0, 0.2> [new_C_3], <0.25, 0.25>
#> [new_C_4], and <0.22, 0> [new_C_2].
#> ℹ Score(s): ELBO = -47073.314. Fit converged in 19 steps, ε = 1e-10.
In what follows, we use the original names.
Plots
Clustering assignments and latent variables statistics
You can plot the data - one dimension against the other - with the
plot_2D (for instance, trye
plot_2D(fit, d1 = 'S1', d2 = 'S2')), or use the S3 function
plot(fit) to compute a list of plots for each pair of
dimensions in the mixture.
plot(fit)
#> Warning: The `x` argument of `as_tibble.matrix()` must have unique column names if
#> `.name_repair` is omitted as of tibble 2.0.0.
#> ℹ Using compatibility `.name_repair`.
#> ℹ The deprecated feature was likely used in the VIBER package.
#>   Please report the issue at <https://github.com/caravagnalab/VIBER/issues>.
#> This warning is displayed once per session.
#> Call `lifecycle::last_lifecycle_warnings()` to see where this warning was
#> generated.
#> Warning: Using `size` aesthetic for lines was deprecated in ggplot2 3.4.0.
#> ℹ Please use `linewidth` instead.
#> ℹ The deprecated feature was likely used in the VIBER package.
#>   Please report the issue at <https://github.com/caravagnalab/VIBER/issues>.
#> This warning is displayed once per session.
#> Call `lifecycle::last_lifecycle_warnings()` to see where this warning was
#> generated.
#> [[1]]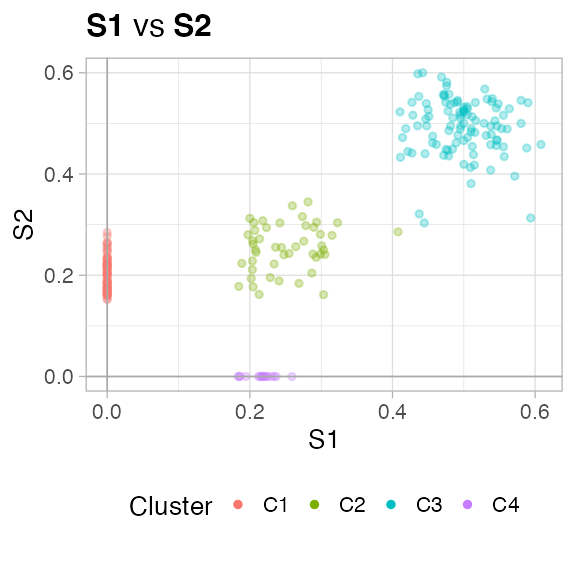
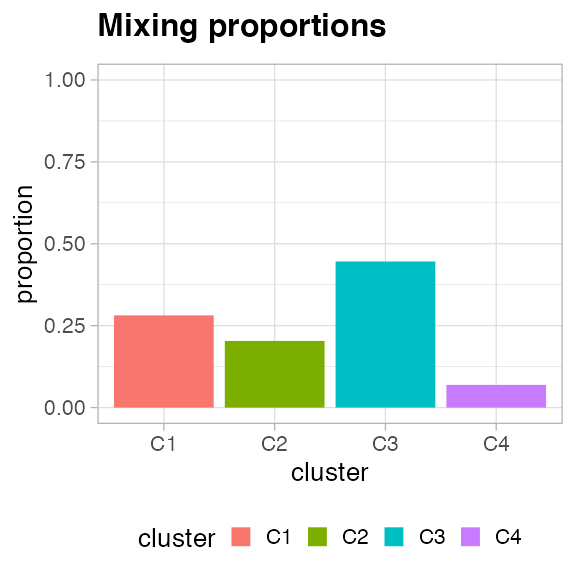
You can plot the mixing proportions of the mixture
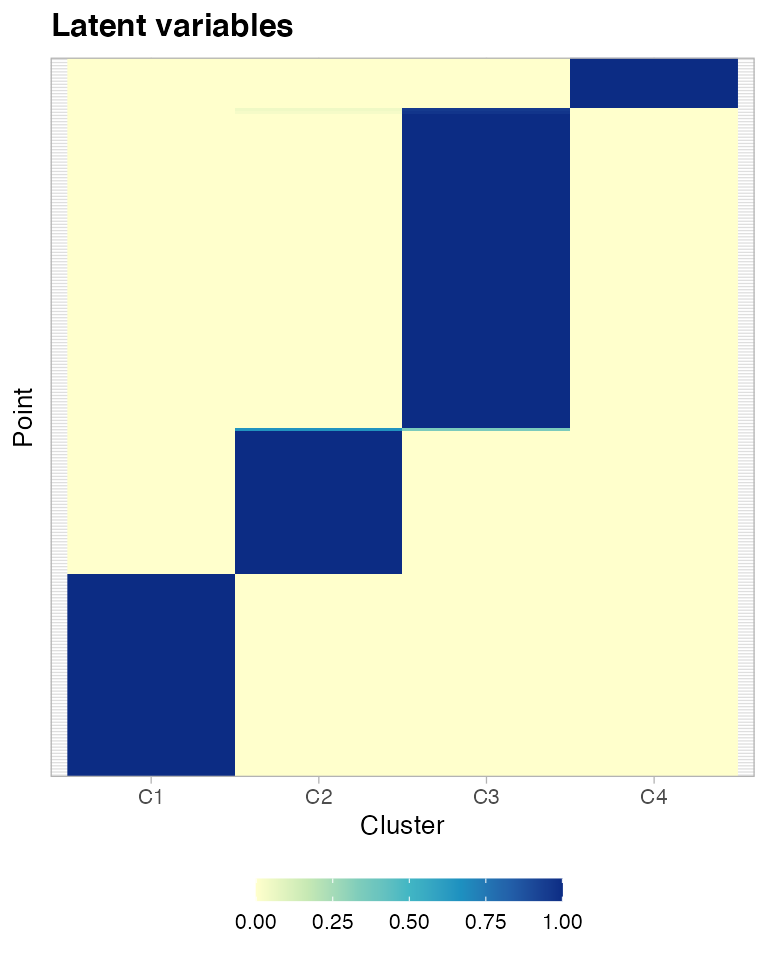
And, finally, you can plot the latent variables of the mixture
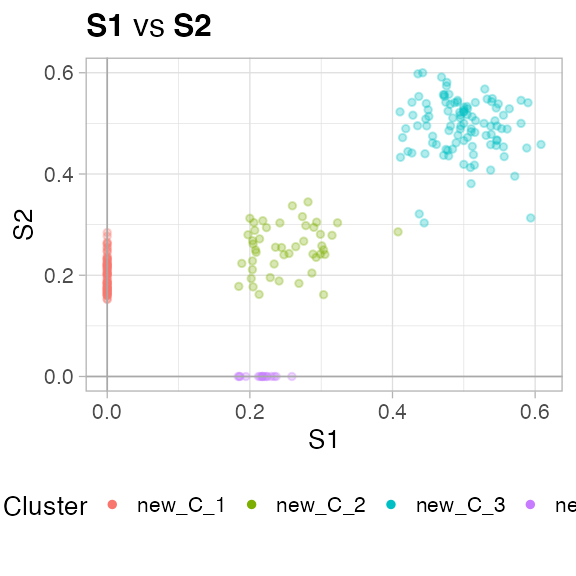
Note the plot of a renamed object
plot(fit_renamed)
#> [[1]]