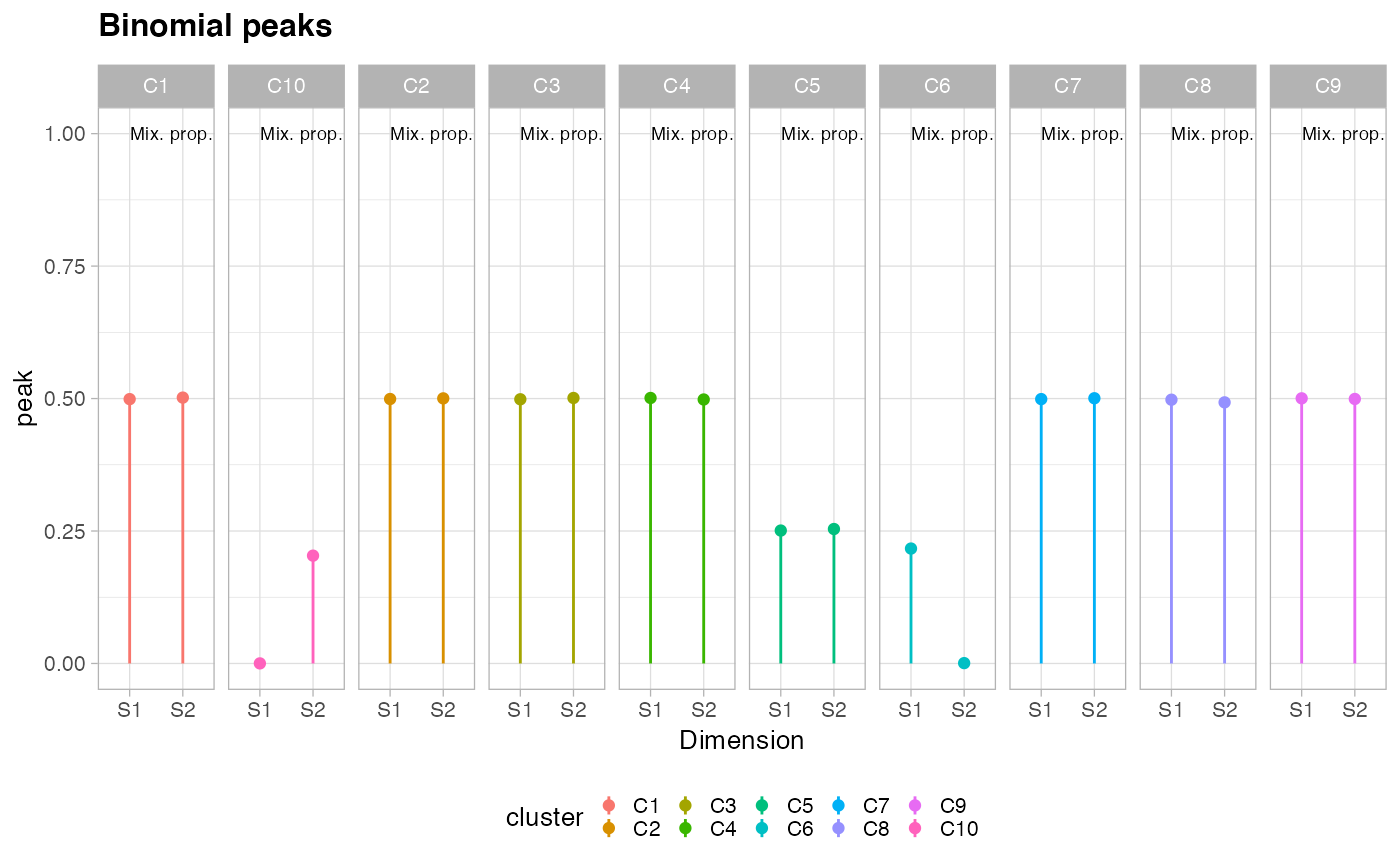
Plot the Binomial peaks of the mixture.
plot_peaks(x, cex = 1, colors = NA)Arguments
Value
A plot of the Binomial peaks per dimension.
Examples
data(fit_mvbmm_example)
plot_peaks(fit_mvbmm_example)
Plot the Binomial peaks of the mixture.
plot_peaks(x, cex = 1, colors = NA)A plot of the Binomial peaks per dimension.
data(fit_mvbmm_example)
plot_peaks(fit_mvbmm_example)