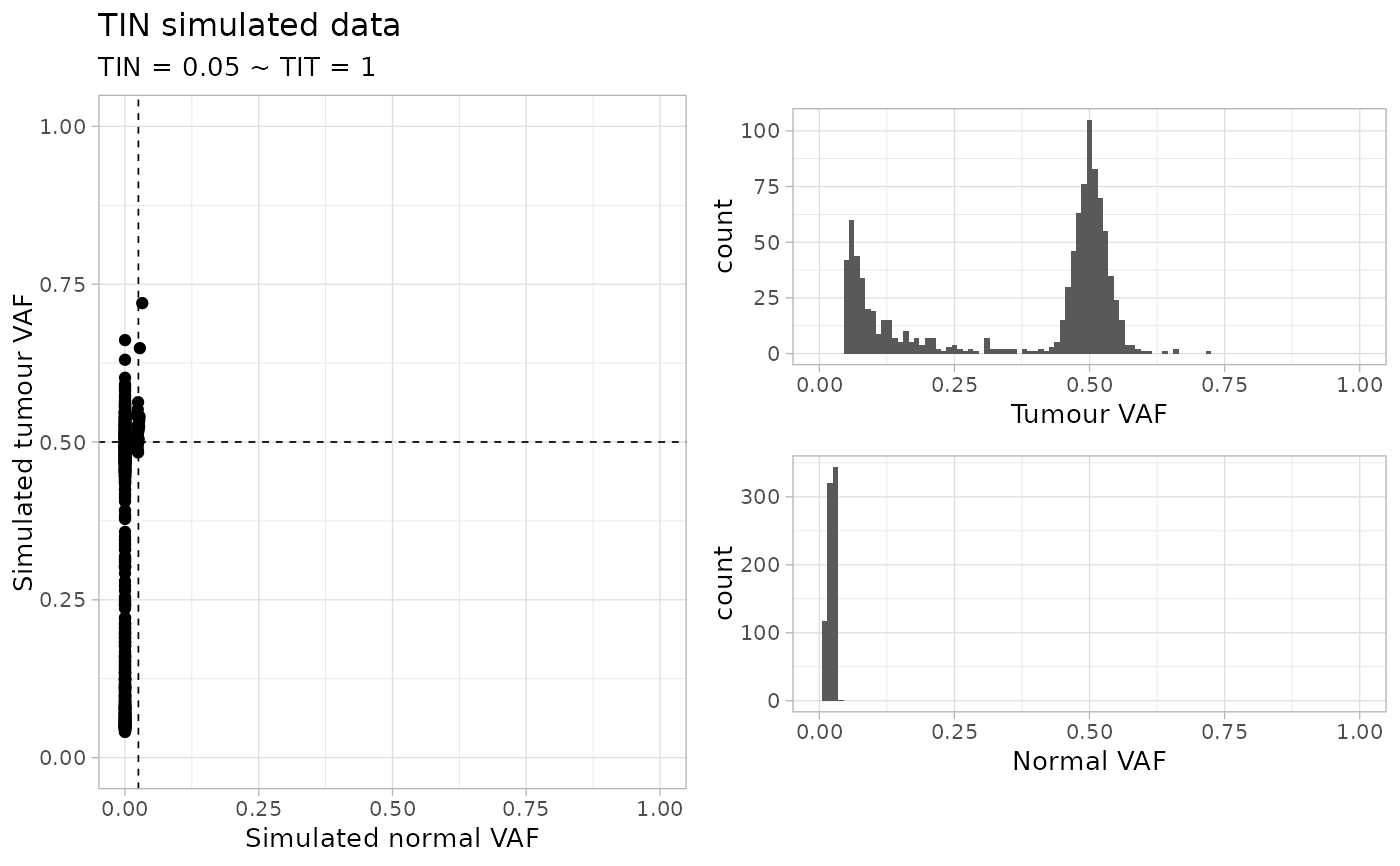
This function simulates a random dataset for TINC analysis,
with mutations and copy number data. Segments are not real, they are assumed
to be constant heterozygous diploid (Major = minor = 1) and span just
mutations (for mappability).
This samples has some noise so that the obtained TIT score might be slightly lower than the required input.
random_TIN(
  N = 1000,
  TIN = 0.05,
  TIT = 1,
  normal_coverage = 30,
  tumour_coverage = 120
)
Arguments
- N
Number of input simulations
- TIN
TIN - Tumour in normal contamination level.
- TIT
TIT - Tumour in tumour contamination level (aka tumour purity).
- normal_coverage
Normal coverage (mean).
- tumour_coverage
Tumour coverage (mean).
Value
Tibbles with the data, and a plot.
Examples
set.seed(1234)

# Default dataset
random_TIN()
#> ✔ Generated TINC dataset (n = 991 mutations), TIN (0.05) and TIT (1), normal and tumour coverage 30x and 120x.
#> Warning: Removed 2 rows containing missing values or values outside the scale range
#> (`geom_bar()`).
#> Warning: Removed 2 rows containing missing values or values outside the scale range
#> (`geom_bar()`).
#> $data
#> # A tibble: 991 × 14
#>    chr        from      to ref   alt   simulated_cluster n_tot_count t_tot_count
#>    <chr>     <int>   <dbl> <chr> <chr> <chr>                   <int>       <int>
#>  1 chr21   9350303  9.35e6 T     C     C1                         35         109
#>  2 chr22  34134600  3.41e7 C     A     C1                         40         127
#>  3 chr10  28158356  2.82e7 T     C     C1                         37         120
#>  4 chr13  76030019  7.60e7 G     A     C1                         43         113
#>  5 chr7   80111695  8.01e7 T     C     C1                         27         107
#>  6 chr16  79722541  7.97e7 T     T     C1                         42         122
#>  7 chr10 106104245  1.06e8 A     T     C1                         28         122
#>  8 chr15  95490382  9.55e7 G     G     C1                         24         124
#>  9 chr6   17255265  1.73e7 G     A     C1                         32         120
#> 10 chr7  143422347  1.43e8 C     C     C1                         43         135
#> # ℹ 981 more rows
#> # ℹ 6 more variables: n_alt_count <dbl>, t_alt_count <dbl>, n_ref_count <dbl>,
#> #   t_ref_count <dbl>, sim_t_vaf <dbl>, sim_n_vaf <dbl>
#>
#> $cna
#> # A tibble: 991 × 6
#>    chr        from        to ref   Major minor
#>    <chr>     <dbl>     <dbl> <chr> <dbl> <dbl>
#>  1 chr21   9350302   9350305 T         1     1
#>  2 chr22  34134599  34134602 C         1     1
#>  3 chr10  28158355  28158358 T         1     1
#>  4 chr13  76030018  76030021 G         1     1
#>  5 chr7   80111694  80111697 T         1     1
#>  6 chr16  79722540  79722543 T         1     1
#>  7 chr10 106104244 106104247 A         1     1
#>  8 chr15  95490381  95490384 G         1     1
#>  9 chr6   17255264  17255267 G         1     1
#> 10 chr7  143422346 143422349 C         1     1
#> # ℹ 981 more rows
#>
#> $plot

#>
#>