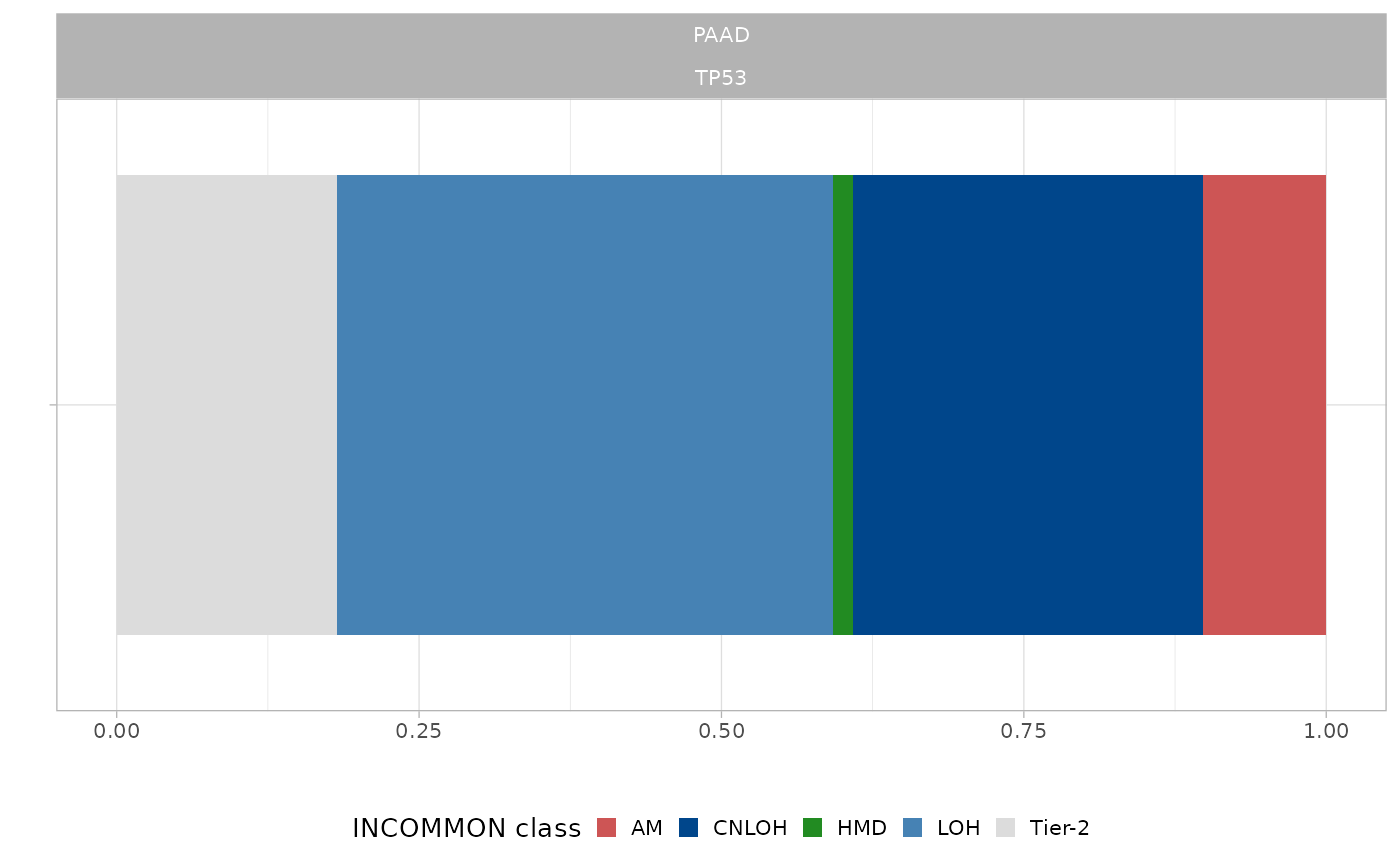
Visualize prior distribution for a gene (tumor-specific or pancancer).
Source:R/plot_prior.R
plot_prior.RdVisualize prior distribution for a gene (tumor-specific or pancancer).
Arguments
- x
A prior distribution in the format required for
INCOMMON, such asINCOMMON::priors_pcawg_hmf.- gene
Gene for gene-specific prior.
- tumor_type
Tumor type for tumor-specific prior ('PANCA' for pan-cancer).
Examples
# First load example classified data
data(MSK_PAAD_output)
# Plot classification results for a specific sample
plot_prior(x = MSK_PAAD_output, gene = 'TP53', tumor_type = 'PAAD')