Plot a clone size histogram, and test for.
plot_clone_size.RdThis function creates a ggplot
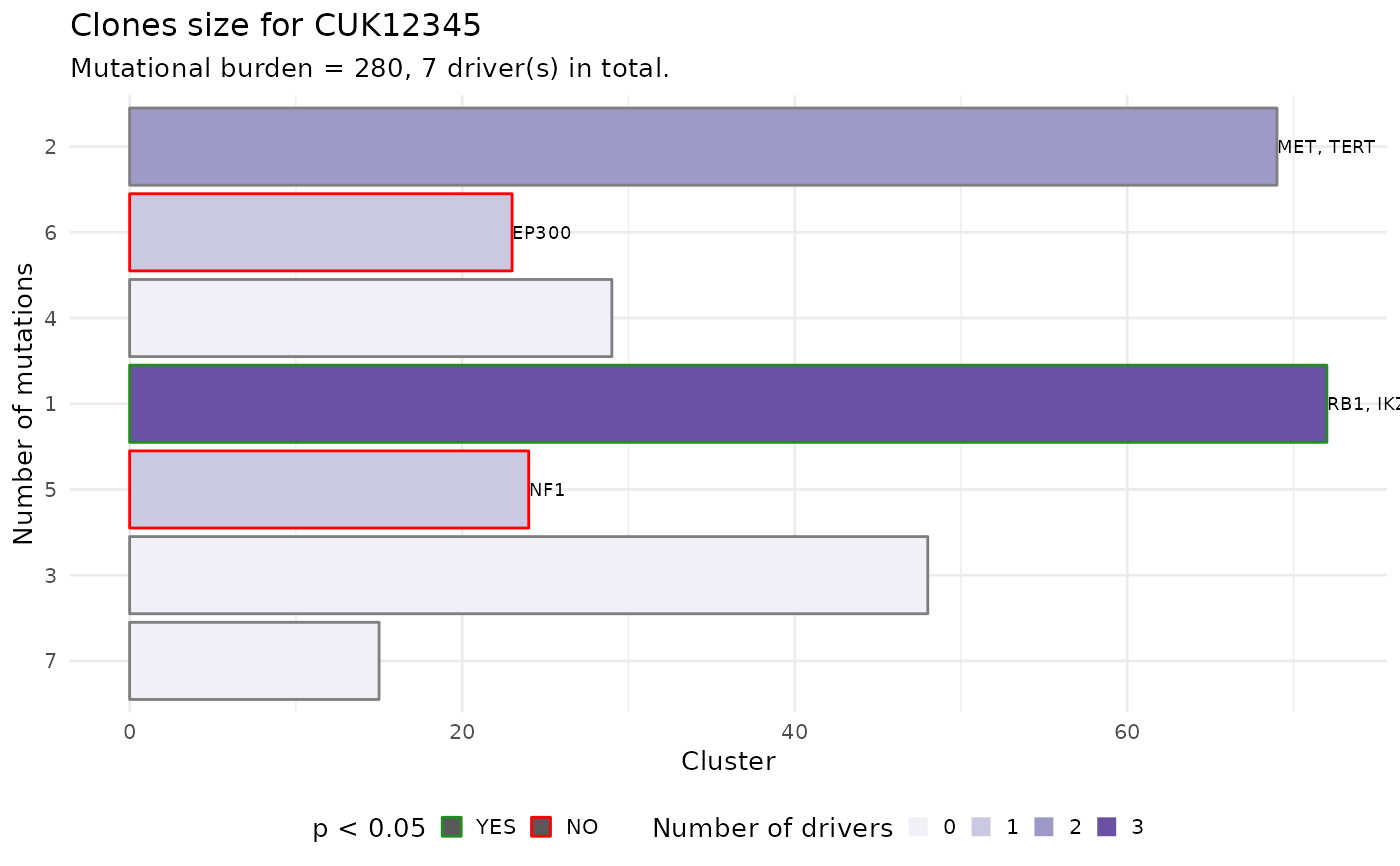
barplot of the clone size values foe each clone in the patient's data.
The size of a clone is defined as the number of mutations assigned
to it, and is provided in input.
The barplot is annotated to report wether a subclone with a driver is significantly larger than the expected size for a subclone without driver. To carry out this test subclones without drivers are used to estimate the parameters of a univariate Gaussian distribution (mean and standard deviation), the p-value is then computed from the fit distribution through the `pnorm` function.
The confidence level for the test can be passed as parameter.
Examples
data('ctree_input')

x = ctrees(
   ctree_input$CCF_clusters,
   ctree_input$drivers,
   ctree_input$samples,
   ctree_input$patient,
   ctree_input$sspace.cutoff,
   ctree_input$n.sampling,
   ctree_input$store.max
   )
#>  [ ctree ~ clone trees generator for CUK12345 ]
#>
#> # A tibble: 7 × 7
#>   cluster nMuts is.driver is.clonal    R1    R2    R3
#>   <chr>   <int> <lgl>     <lgl>     <dbl> <dbl> <dbl>
#> 1 1          72 TRUE      FALSE      0     0.92  0
#> 2 2          69 TRUE      TRUE       0.99  0.98  0.99
#> 3 3          48 FALSE     FALSE      0     0     0.49
#> 4 4          29 FALSE     FALSE      0.01  0.01  0.93
#> 5 5          24 TRUE      FALSE      0.78  0     0
#> 6 6          23 TRUE      FALSE      0.98  0.03  0.98
#> 7 7          15 FALSE     FALSE      0     0.41  0
#>
#> ✔ Trees per region 1, 3, 1
#> ℹ Total 3 tree structures - search is exahustive
#>
#> ── Ranking trees
#> ✔ 3  trees with non-zero score, storing 3

plot_clone_size(x[[1]])
#> Warning: Removed 3 rows containing missing values or values outside the scale range
#> (`geom_text()`).