Plot CCF clusters data (tile).
plot_CCF_clusters.RdThis function creates a ggplot-style
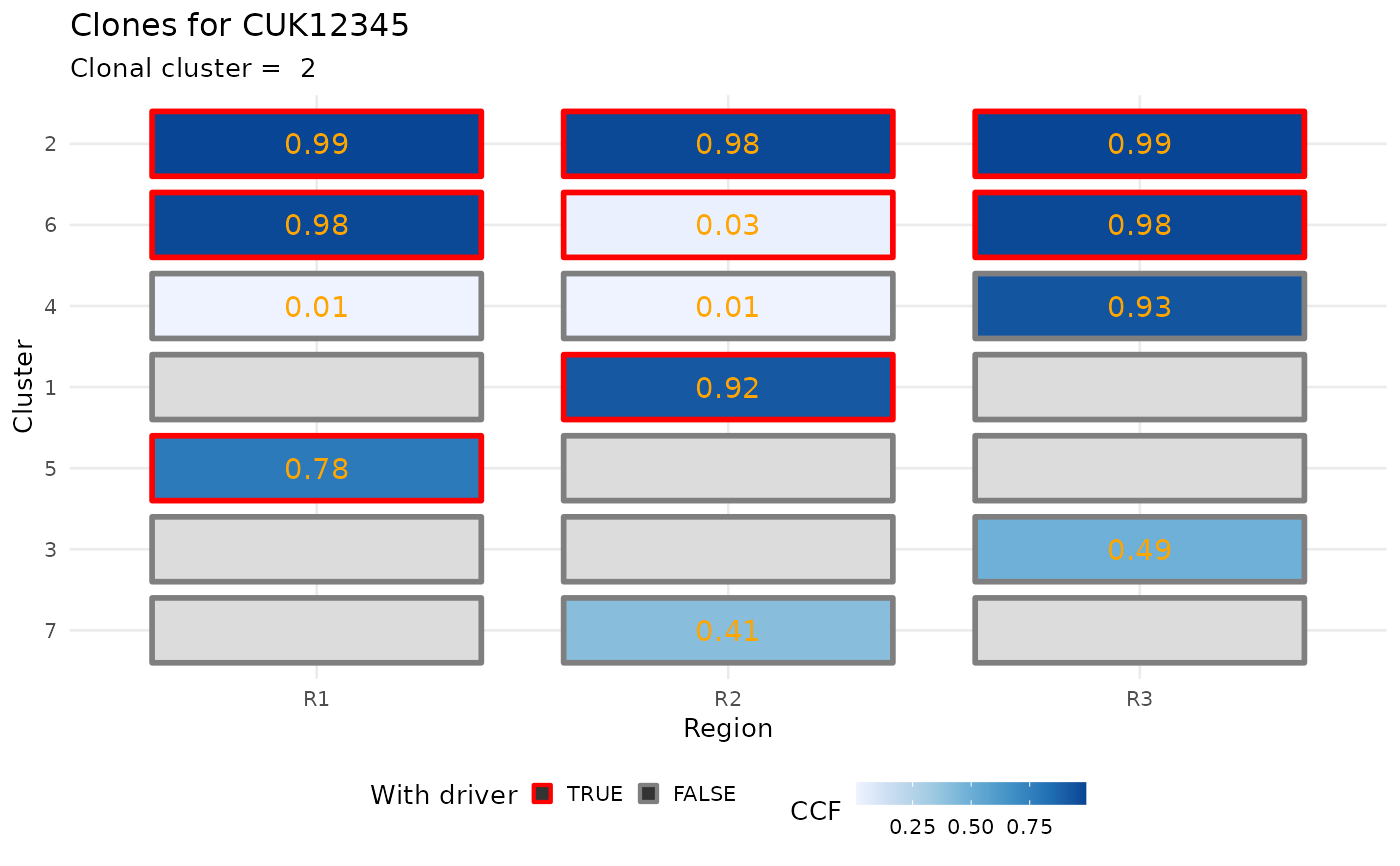
heatmap of the input CCF cluster of each clone in the data.
The heatmap is annotated for the drivers status of each
clone (with/ without driver). The CCF values are used to
colour the heatmap (`NA` values are in light gray).
Examples
data(ctree_input)

x = ctrees(
ctree_input$CCF_clusters,
ctree_input$drivers,
ctree_input$samples,
ctree_input$patient,
ctree_input$sspace.cutoff,
ctree_input$n.sampling,
ctree_input$store.max
)
#>  [ ctree ~ clone trees generator for CUK12345 ]
#>
#> # A tibble: 7 × 7
#>   cluster nMuts is.driver is.clonal    R1    R2    R3
#>   <chr>   <int> <lgl>     <lgl>     <dbl> <dbl> <dbl>
#> 1 1          72 TRUE      FALSE      0     0.92  0
#> 2 2          69 TRUE      TRUE       0.99  0.98  0.99
#> 3 3          48 FALSE     FALSE      0     0     0.49
#> 4 4          29 FALSE     FALSE      0.01  0.01  0.93
#> 5 5          24 TRUE      FALSE      0.78  0     0
#> 6 6          23 TRUE      FALSE      0.98  0.03  0.98
#> 7 7          15 FALSE     FALSE      0     0.41  0
#>
#> ✔ Trees per region 1, 3, 1
#> ℹ Total 3 tree structures - search is exahustive
#>
#> ── Ranking trees
#> ✔ 3  trees with non-zero score, storing 3

plot_CCF_clusters(x[[1]])
#> Warning: Removed 8 rows containing missing values or values outside the scale range
#> (`geom_text()`).