Plot a ctree tree.
plot.ctree.RdThis S3 method plots a ctree tree, using ggraph layout
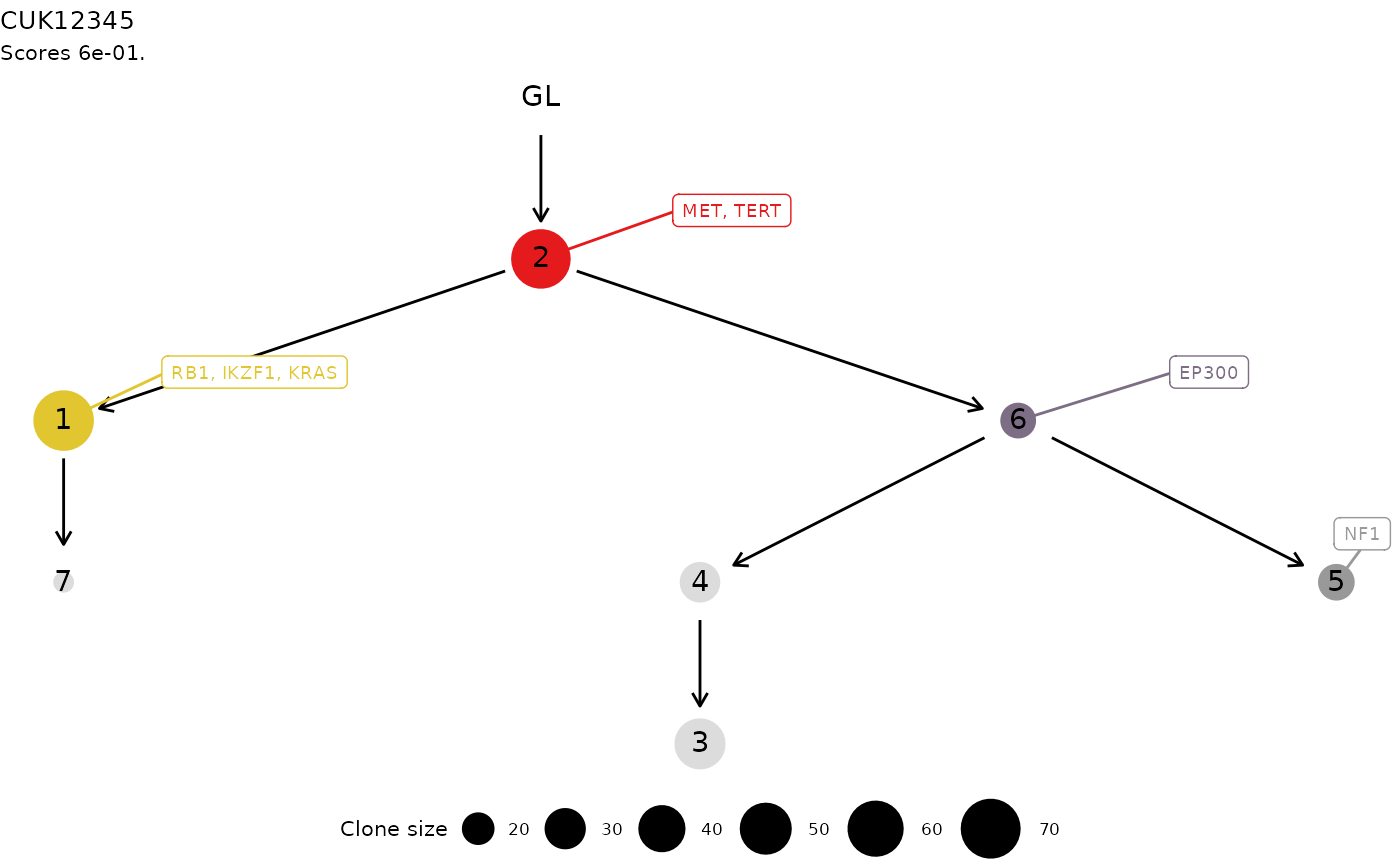
functions. The tree is annotated and coloured in each node (i.e.,
cluster) that contain a driver event annotated. The driver id is also
reported via ggrepel annotation functions.
Usage
# S3 method for class 'ctree'
plot(
  x,
  node_palette = colorRampPalette(RColorBrewer::brewer.pal(n = 9, "Set1")),
  tree_layout = "tree",
  ...
)
Arguments
- x
A
ctreetree.- node_palette
A function that applied to a number will return a set of colors. By default this is a
colorRampPaletteapplied to 9 colours of theRColorBrewerpaletteSet1. Colors are generated following a topological sort of the information transfer, which is obtained fromigraph.- tree_layout
A layout that can be used by
tidygraph, which wrapsigraph's layouts. By default this is a `tree` layout.- ...
Extra S3 parameters
Examples
data('ctree_input')

x = ctrees(
   ctree_input$CCF_clusters,
   ctree_input$drivers,
   ctree_input$samples,
   ctree_input$patient,
   ctree_input$sspace.cutoff,
   ctree_input$n.sampling,
   ctree_input$store.max
   )
#>  [ ctree ~ clone trees generator for CUK12345 ]
#>
#> # A tibble: 7 × 7
#>   cluster nMuts is.driver is.clonal    R1    R2    R3
#>   <chr>   <int> <lgl>     <lgl>     <dbl> <dbl> <dbl>
#> 1 1          72 TRUE      FALSE      0     0.92  0
#> 2 2          69 TRUE      TRUE       0.99  0.98  0.99
#> 3 3          48 FALSE     FALSE      0     0     0.49
#> 4 4          29 FALSE     FALSE      0.01  0.01  0.93
#> 5 5          24 TRUE      FALSE      0.78  0     0
#> 6 6          23 TRUE      FALSE      0.98  0.03  0.98
#> 7 7          15 FALSE     FALSE      0     0.41  0
#>
#> ✔ Trees per region 1, 3, 1
#> ℹ Total 3 tree structures - search is exahustive
#>
#> ── Ranking trees
#> ✔ 3  trees with non-zero score, storing 3

plot(x[[1]])