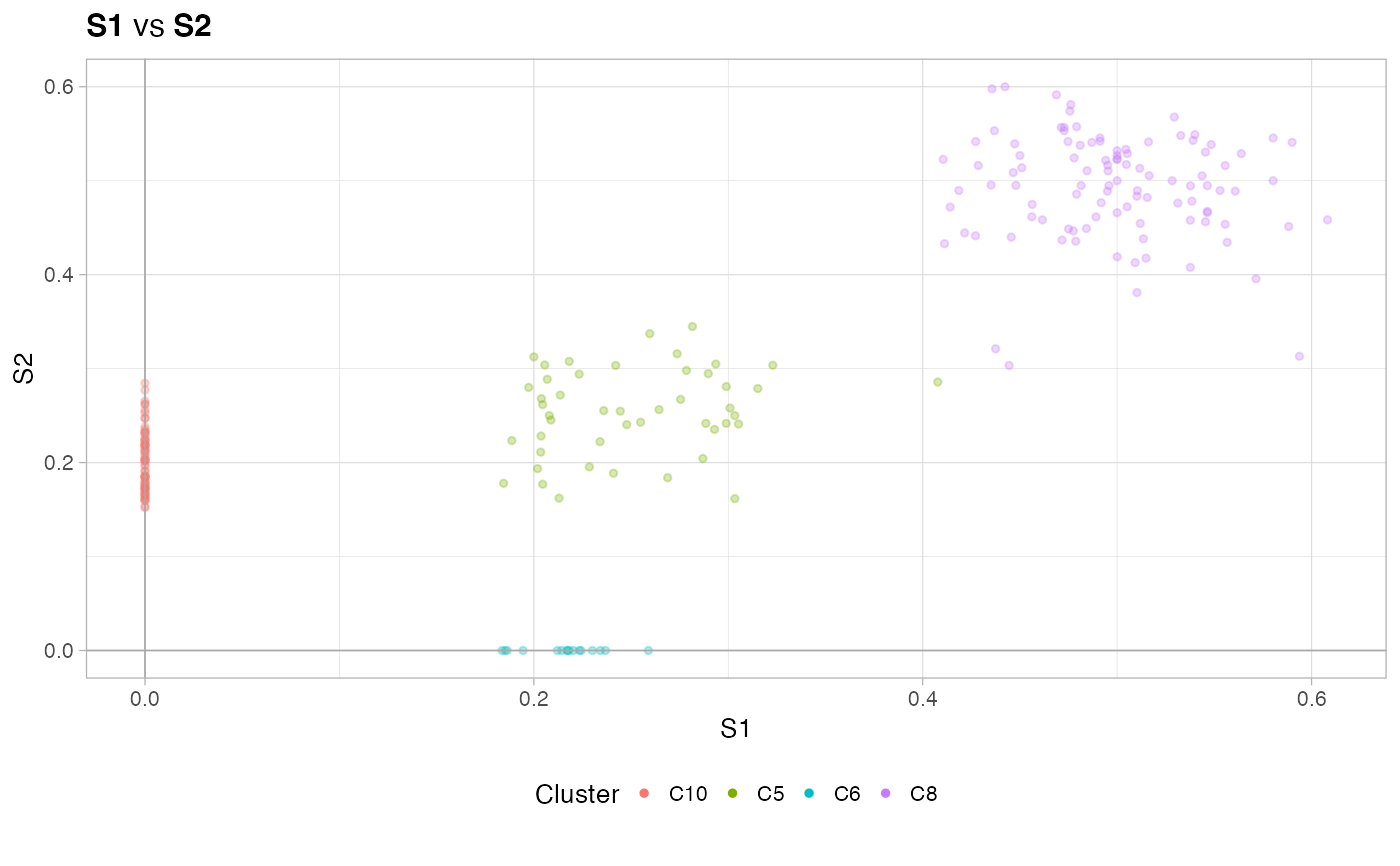
Plot the fit for two dimensions, one against the other. Colour each point (defined as the ratio of sucesses over trail) according to the clustering assignments.
plot_2D(
  x,
  d1,
  d2,
  cex = 1,
  alpha = 0.3,
  cut_zeroes = TRUE,
  binning_n = NA,
  binning_b = NA,
  downsample = Inf,
  colors = NA,
  bin_params = FALSE
)
Arguments
- x
An object of class 'vb_bmm'.
- d1
The name of the dimension to plot (x-axis).
- d2
The name of the dimension to plot (y-axis).
- cex
Cex of the points and the overall plot.
- alpha
Alpha of the points.
- cut_zeroes
If
TRUE, remove points that are 0 in both dimensions.- binning_n
This parameter goes with
binning_b. If bothNA, no binnig is computed. If an integer value points are binned in a grid of size defined bybinning_b, and up tobinning_npoints are sampled per bin according to each cluster whose points map inside the bin.- binning_b
This parameter goes with
binning_n. If bothNA, no binning is computed. If a real valuem points are binned in a grid of sizebinning_bbybinning_b.- downsample
Maximun number of points to plot. Default is
Inf, no downsampling.- colors
Optional vector of colors, default (
NA) areggplotcolors.- bin_params
If
TRUEit adds also a point to show the fit Binomial success probabilities.
Value
A ggplot object.
Examples
data(fit_mvbmm_example)

# Sample names are "S1" and "S2" for this dataset
plot_2D(fit_mvbmm_example, "S1", "S2")