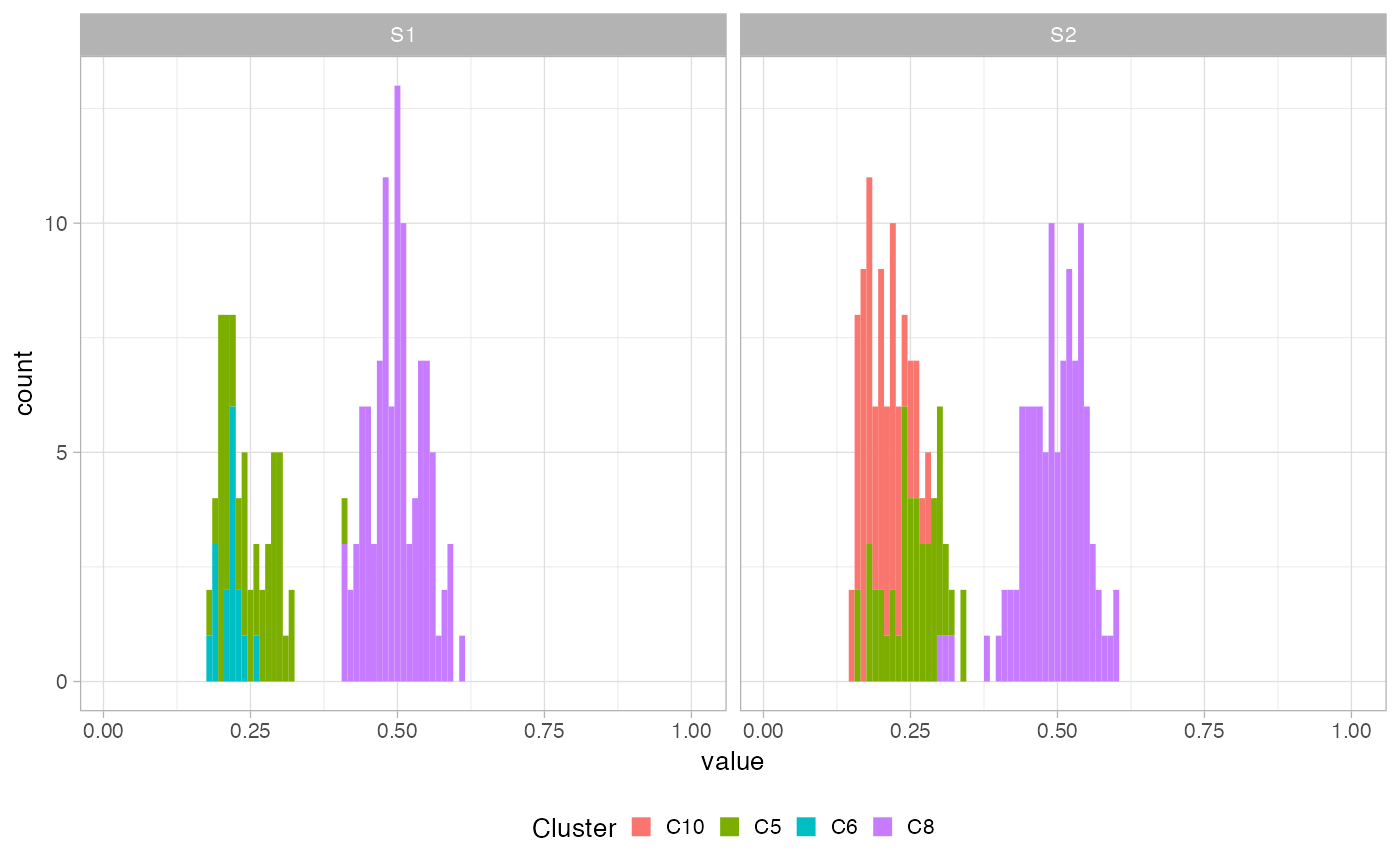
Plot a histogram of successes over trials, coloured by clustering assignments and with a facet for each sample.
plot_1D(x, colors = NA)Arguments
Value
A ggplot object
Examples
data(fit_mvbmm_example)

plot_1D(fit_mvbmm_example)
#> Using cluster.Binomial as id variables
#> Warning: Removed 81 rows containing non-finite outside the scale range (`stat_bin()`).
#> Warning: Removed 12 rows containing missing values or values outside the scale range
#> (`geom_bar()`).