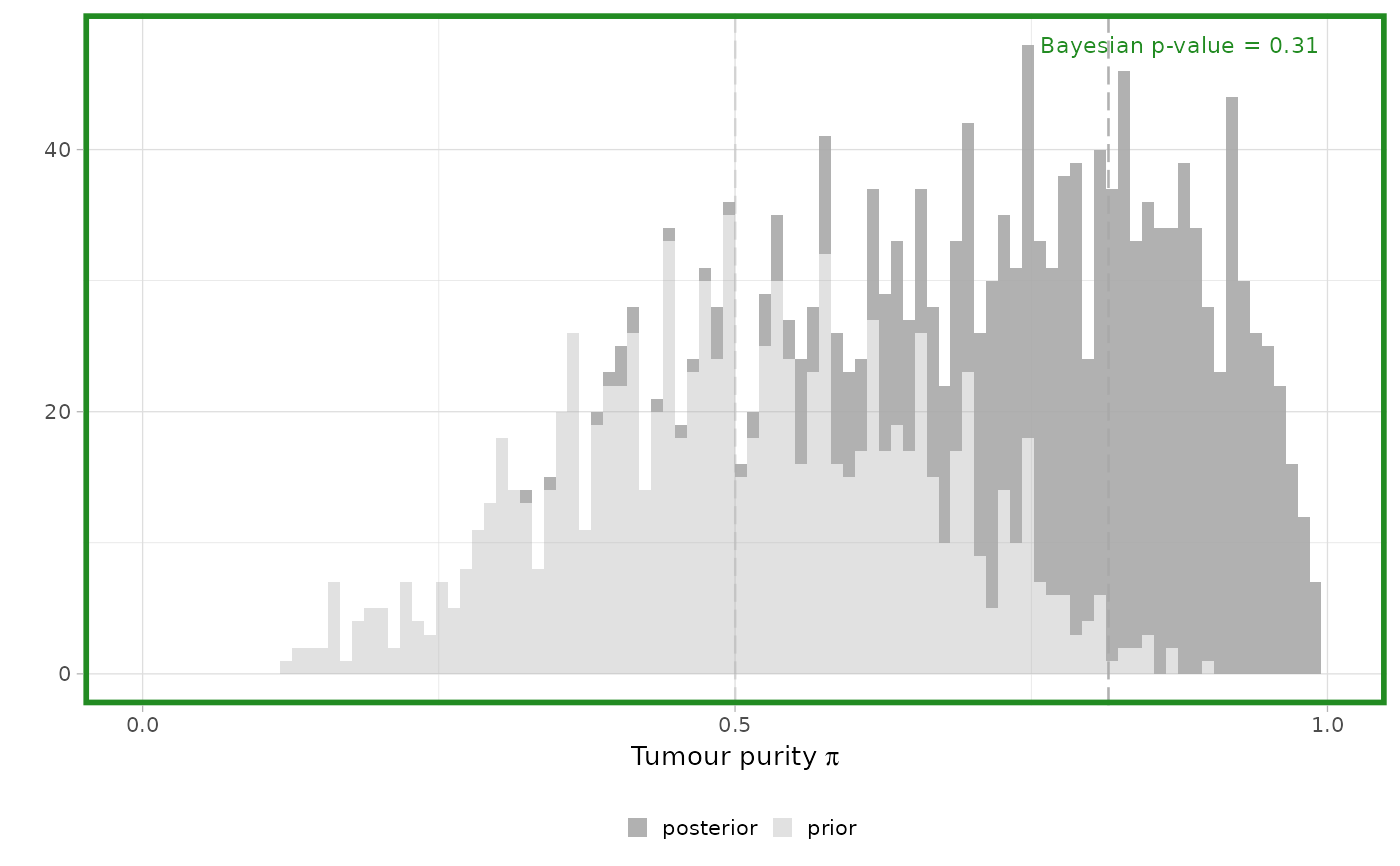
Compares prior and posterior predictive distributions of tumour purity
(\(\pi\)) and reports the Bayesian p-value for the posterior predictive check.
Usage
plot_purity_check(posterior_purity_rep, prior_purity_rep, bayes_p)
Arguments
- posterior_purity_rep
Numeric vector of posterior replicated purity values.
- prior_purity_rep
Numeric vector of prior replicated purity values.
- bayes_p
Numeric Bayesian p-value for the posterior predictive check.
Value
A ggplot2 histogram showing prior and posterior predictive
distributions with median reference lines and Bayesian p-value annotation.
Examples
set.seed(123)
posterior_purity_rep = rbeta(1000, 8, 2)
prior_purity_rep = rbeta(1000, 5, 5)
plot_purity_check(posterior_purity_rep, prior_purity_rep, bayes_p = 0.31)
#> Warning: Removed 4 rows containing missing values or values outside the scale range
#> (`geom_bar()`).