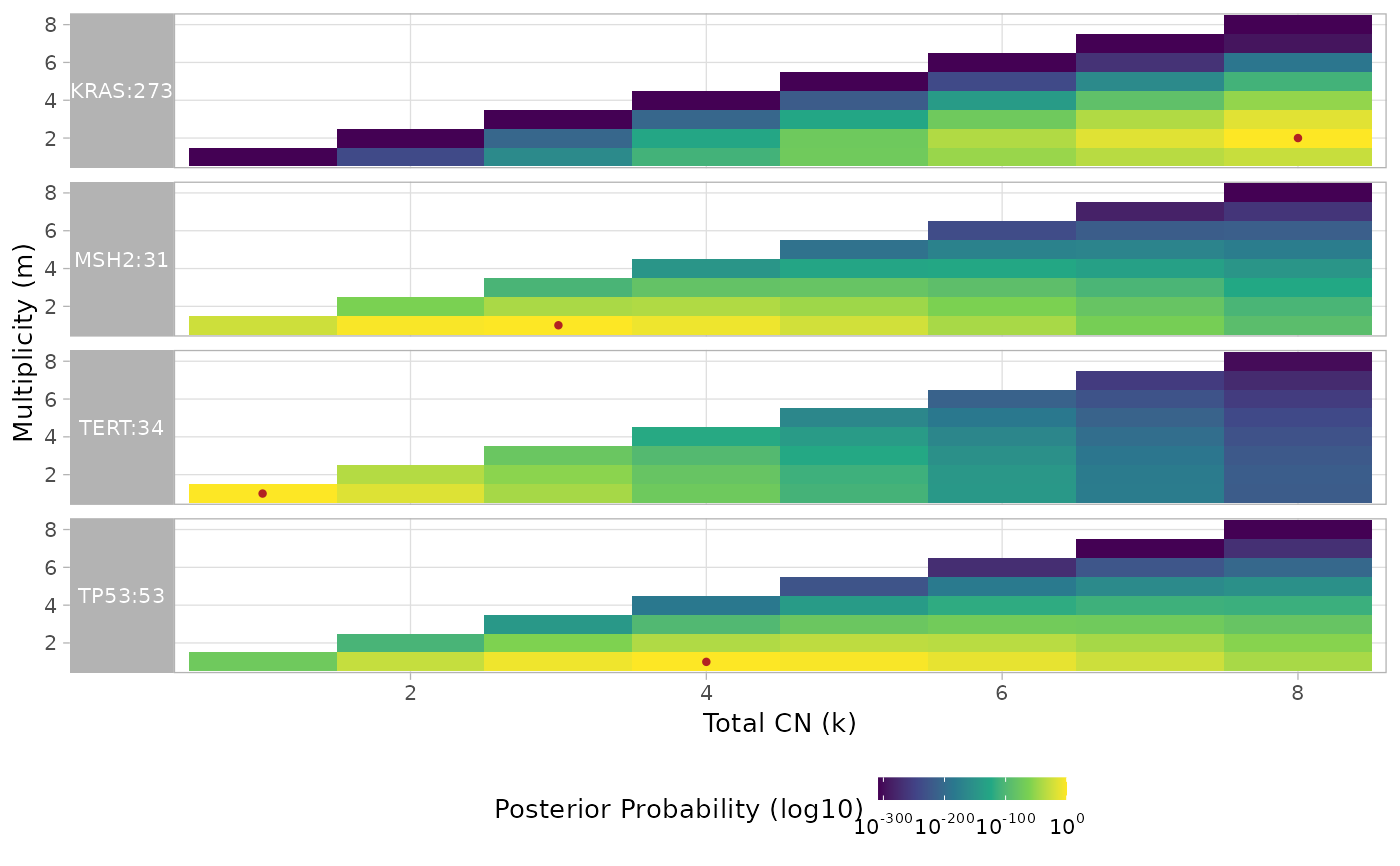
Visualise the posterior distribution on (k,m) configurations.
Source:R/plot_posterior_k_m.R
plot_posterior_k_m.RdVisualise the posterior distribution on (k,m) configurations.
Examples
# First load example classified data
data(MSK_PAAD_output)
# Plot classification results for a specific sample
x = subset_sample(x = MSK_PAAD_output, sample_list = "P-0000142")
plot_posterior_k_m(x = x)