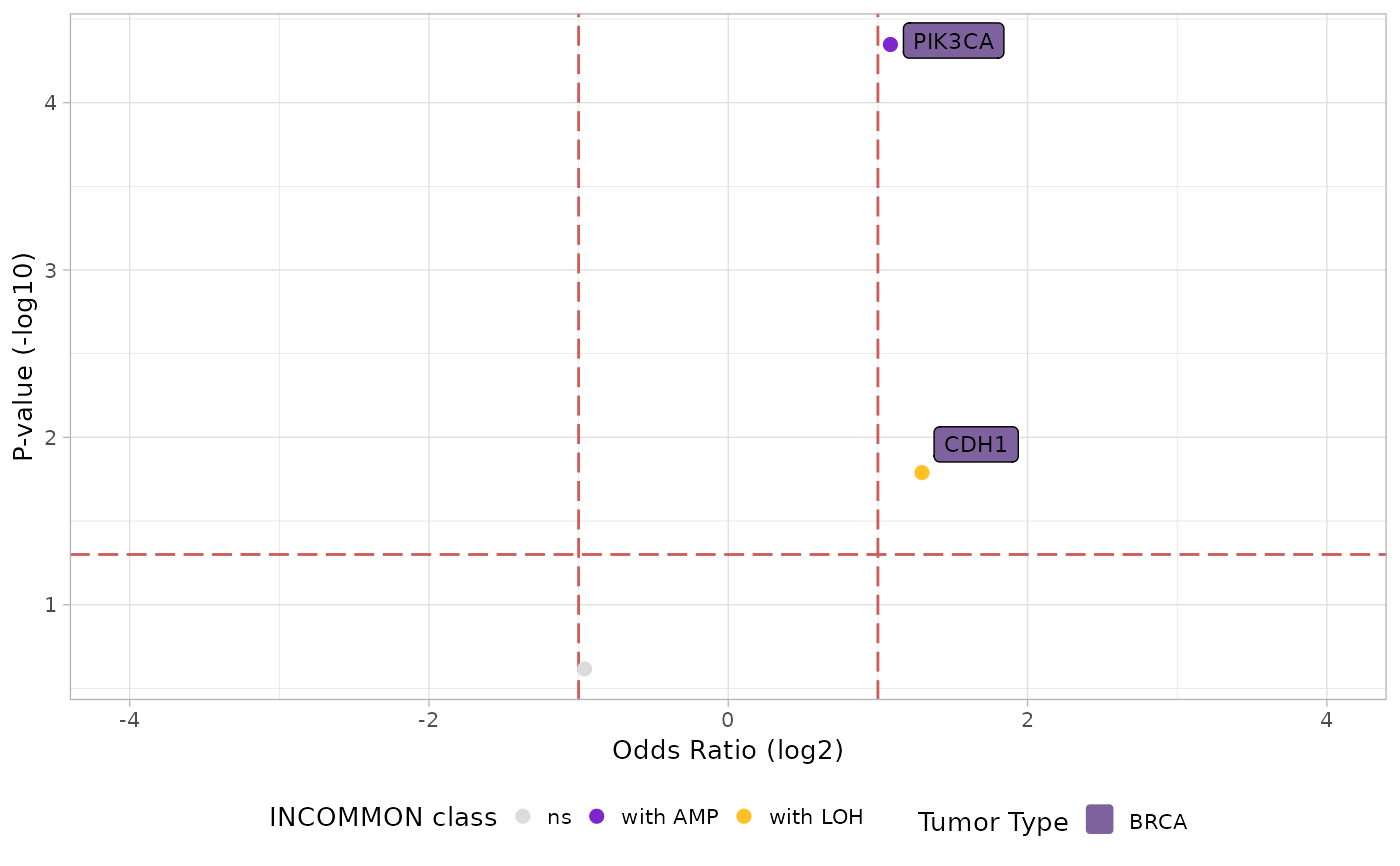
Visualize metastatic propnesity odds ratio in a volcano plot fashion.
Source:R/plot_met_volcano.R
plot_met_volcano.RdVisualize metastatic propnesity odds ratio in a volcano plot fashion.
Examples
# First load example classified data
data(MSK_PAAD_output)
# Estimate the metastatic propensity associated with mutant KRAS and CDKN2A high vs balanced dosage.
for(g in c('KRAS', 'CDKN2A')){MSK_PAAD_output = met_propensity(x = MSK_PAAD_output, tumor_type = 'PAAD', gene = g)}
#> Joining with `by = join_by(id)`
#> Waiting for profiling to be done...
#> Waiting for profiling to be done...
#> # A tibble: 1 × 6
#>   gene  class          OR   low    up p.value
#>   <chr> <chr>       <dbl> <dbl> <dbl>   <dbl>
#> 1 KRAS  High Dosage 0.584 0.348 0.986  0.0423
#> Waiting for profiling to be done...
#> Waiting for profiling to be done...
#> # A tibble: 1 × 6
#>   gene   class          OR   low    up p.value
#>   <chr>  <chr>       <dbl> <dbl> <dbl>   <dbl>
#> 1 CDKN2A High Dosage  3.46  1.21  9.24  0.0153
# Plot results in a volcano plot
plot_met_volcano(x = MSK_PAAD_output, tumor_type = 'PAAD')