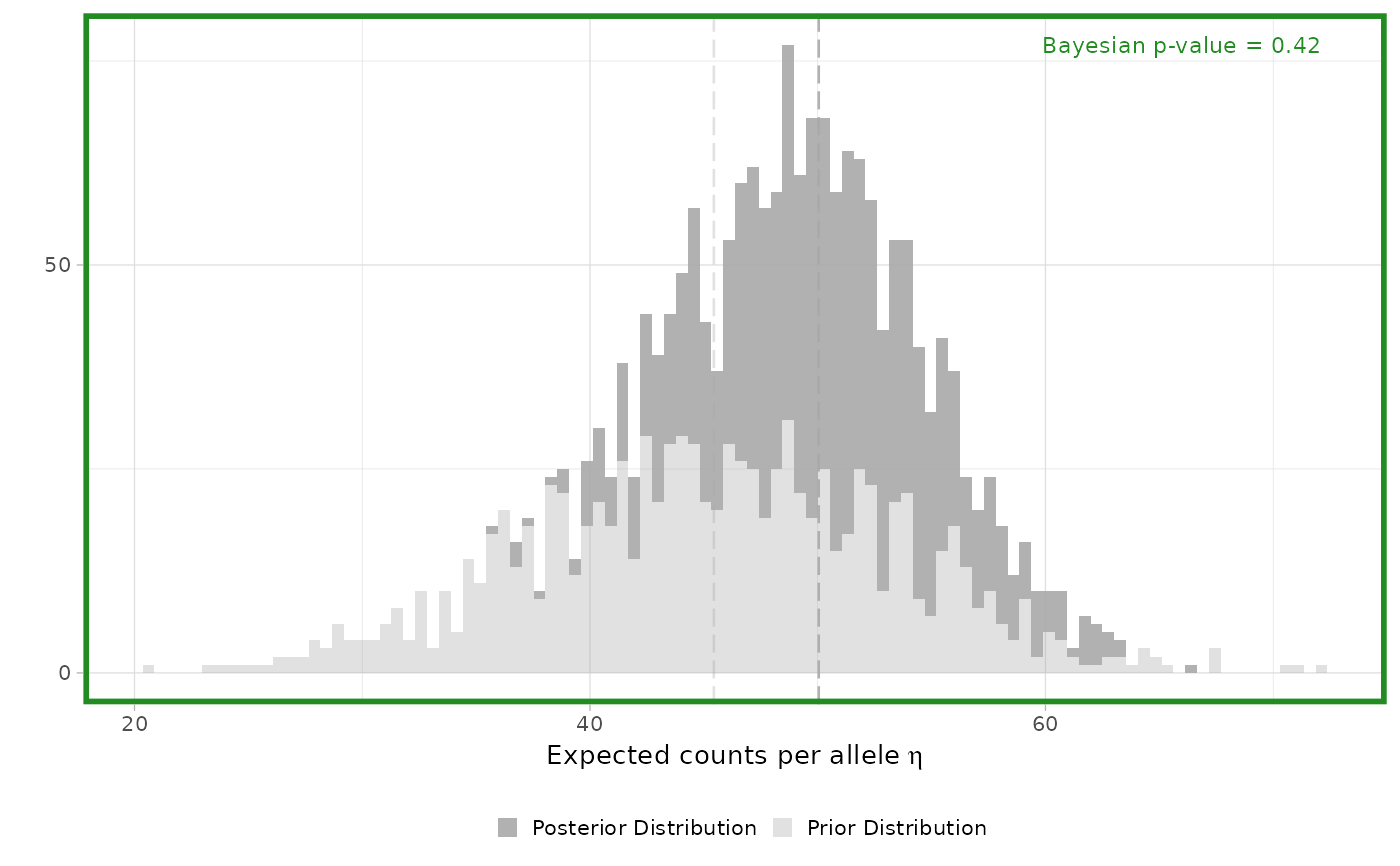
Visualises the posterior and prior predictive distributions of the
expected counts per allele (\(\eta\)) and reports the Bayesian p-value
from the posterior predictive check.
Usage
plot_eta_check(posterior_eta_rep, prior_eta_rep, bayes_p)
Arguments
- posterior_eta_rep
Numeric vector of posterior replicated \(\eta\) values.
- prior_eta_rep
Numeric vector of prior replicated \(\eta\) values.
- bayes_p
Numeric Bayesian p-value for the posterior predictive check.
Value
A ggplot2 histogram comparing prior and posterior predictive
distributions with vertical median reference lines and the Bayesian p-value.
Examples
set.seed(123)
posterior_eta_rep = rnorm(1000, mean = 50, sd = 5)
prior_eta_rep = rnorm(1000, mean = 45, sd = 8)
plot_eta_check(posterior_eta_rep, prior_eta_rep, bayes_p = 0.42)