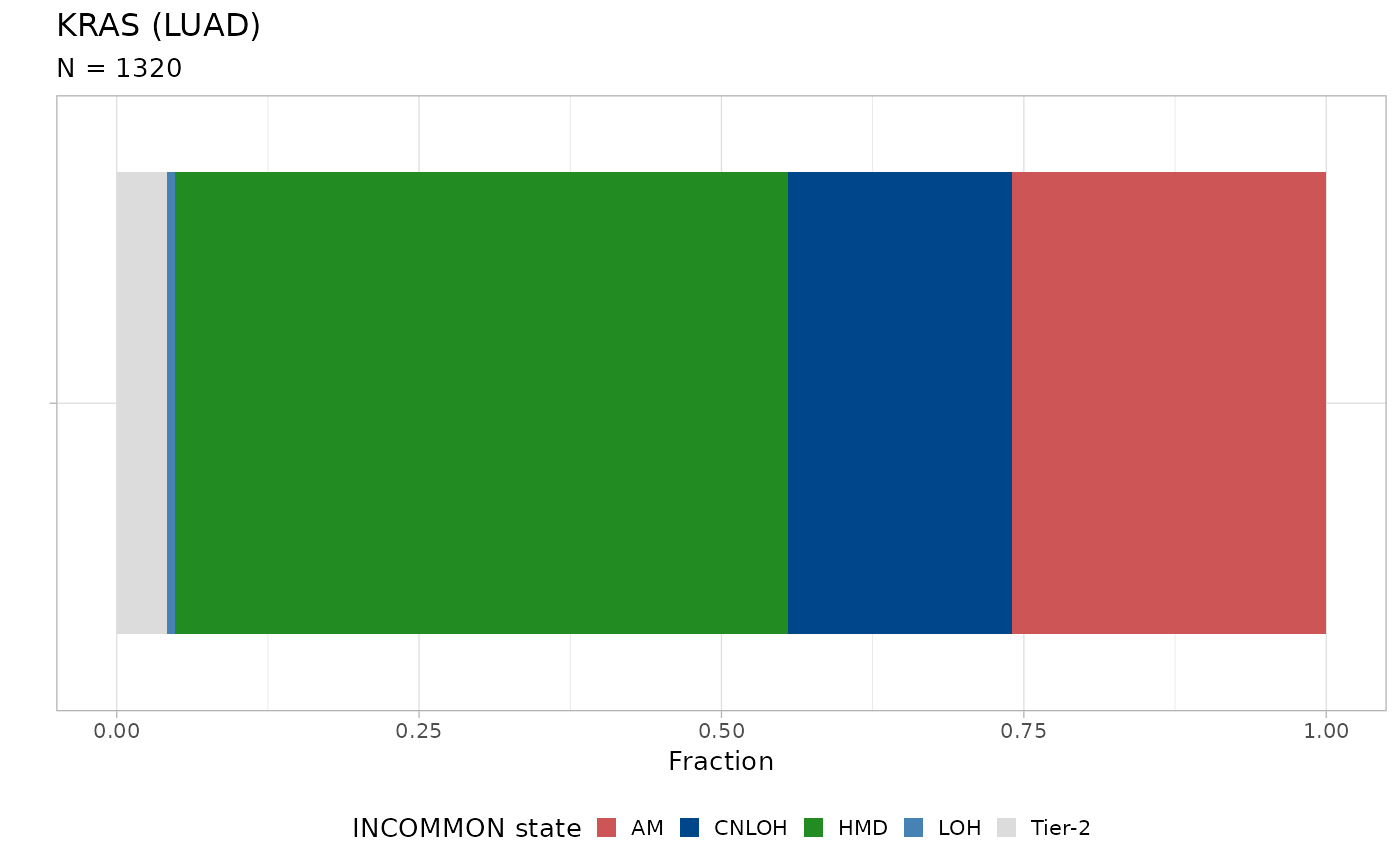
Visualize frequency distribution of INCOMMON classes.
Source:R/plot_class_fraction.R
plot_class_fraction.RdVisualize frequency distribution of INCOMMON classes.
Examples
# First load example classified data
data(MSK_PAAD_output)
# Plot class fraction for a specific gene and tumour type
MSK_PAAD_output = mutant_dosage_classification(MSK_PAAD_output)
#> Joining with `by = join_by(id)`
plot_class_fraction(x = MSK_PAAD_output, tumor_type = 'PAAD', gene = 'KRAS')