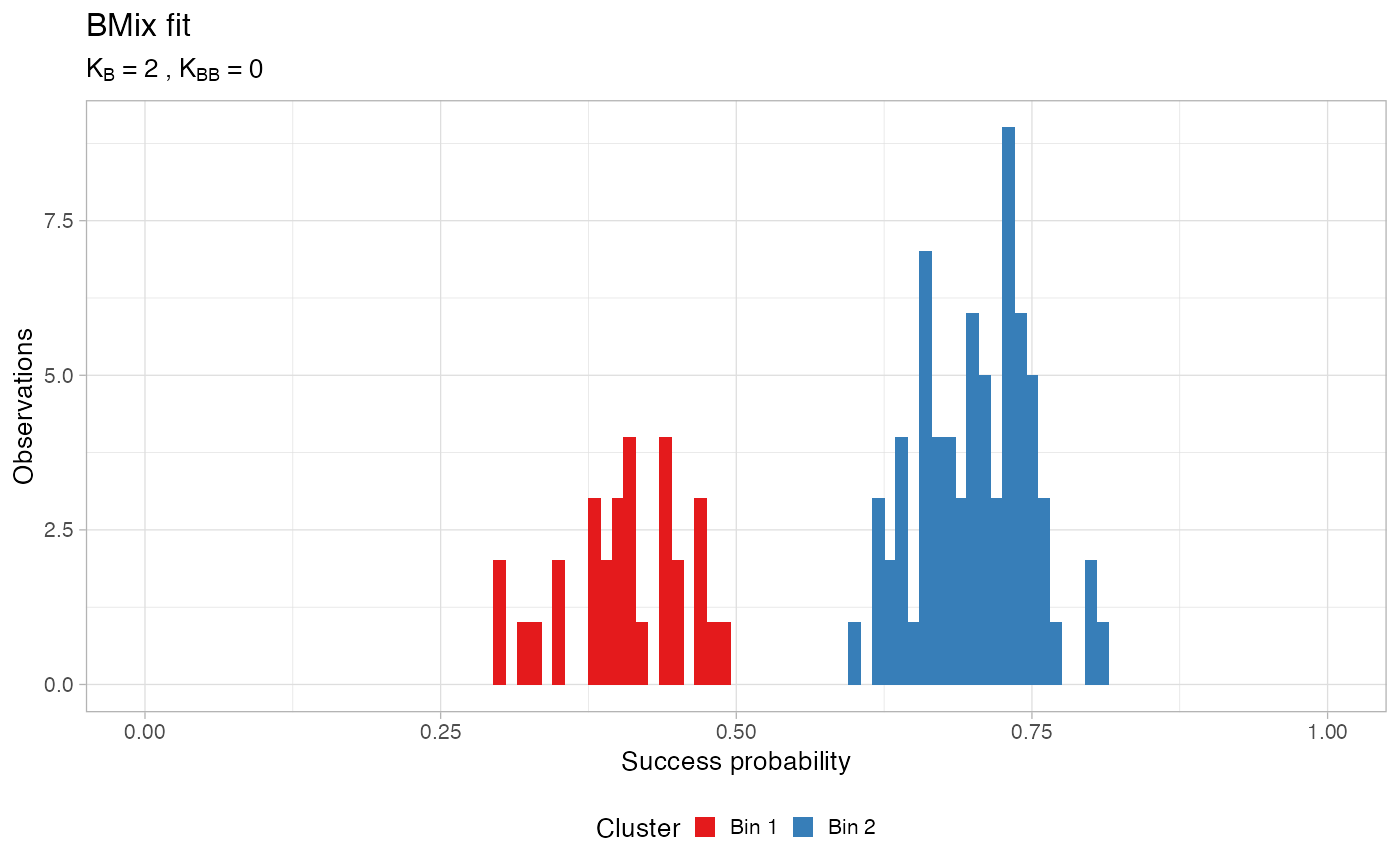
This functions plots the data as histogram, coloured according to the hard clustering assignments. This function must receive in input exactly the same data used for the fit.
plot_clusters(x, data)
Arguments
| x | An object of class |
|---|---|
| data | The data used to compute the fit |
Value
A ggplot object.
Examples
# The same dataset used in the package vignette data = data.frame(successes = c(rbinom(30, 100, .4), rbinom(70, 100, .7)), trials = 100) # BMix fit with default parameters x = bmixfit(data)#>#>#>#> ℹ Binomials k_B = 1 and 2, Beta-Binomials k_BB = 0; 4 fits to run.#>#> ℹ Bmix best fit completed in 0 mins#>#> [ BMix ] My BMix model n = 100 with k = 2 component(s) (2 + 0) ──────────────#> Bin 2] and 30% [Bin 1], with π > 0.#> Bin 1 with mean = 0.405686308124697.#> Bin 2 with mean = 0.702142726335277.#> ℹ Score (model selection): ICL = 740.62.plot_clusters(x, data)#> Warning: Removed 4 rows containing missing values (geom_bar).
