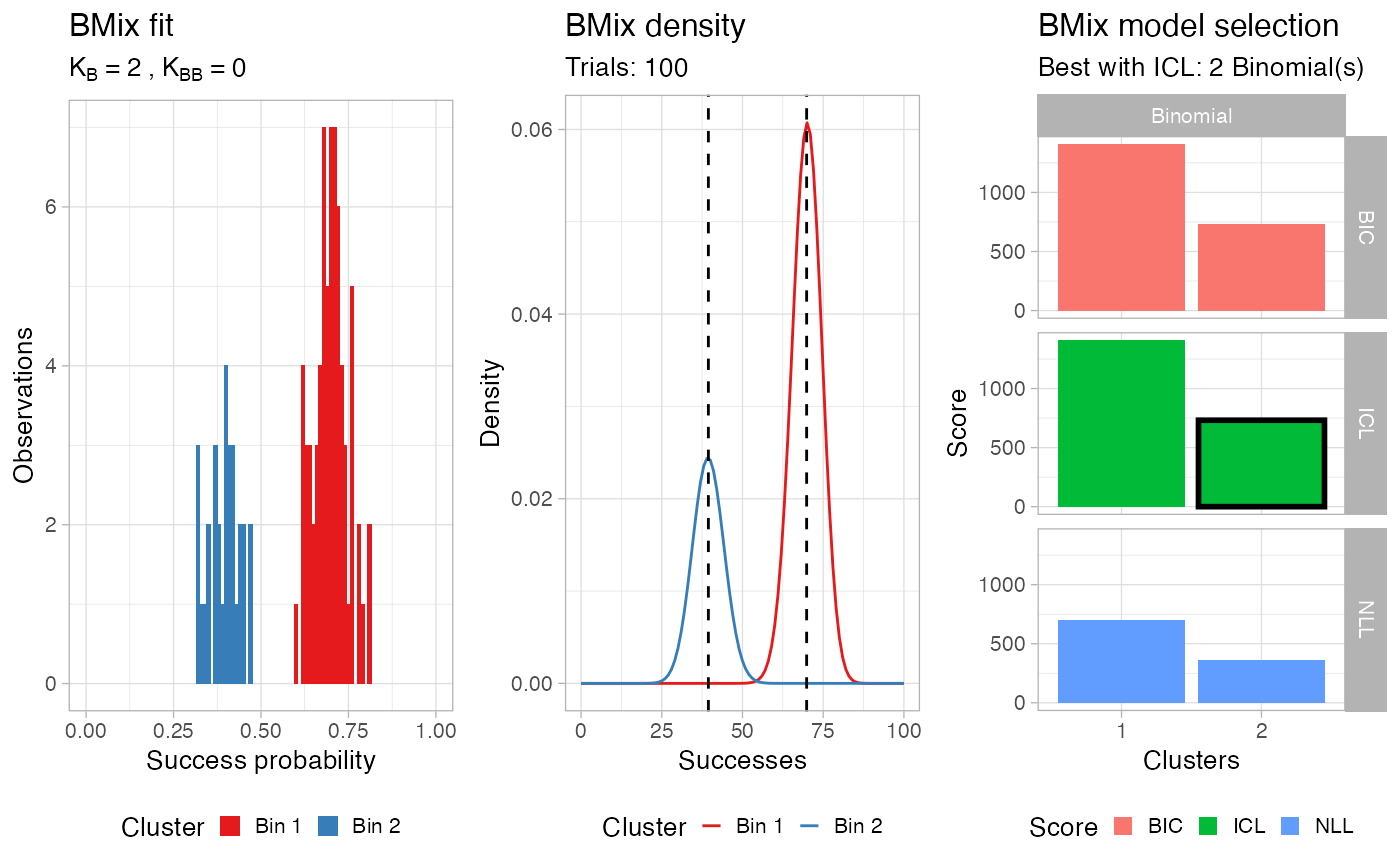
Assemble a multi-panel plot using the plotting functions
of the Bmix package, with default parameters.
plot.bmix(x, ...)
Arguments
| x | An object of class |
|---|---|
| ... | The ellipsis should contain a |
Value
A cowplot figure.
Examples
# The same dataset used in the package vignette data = data.frame(successes = c(rbinom(30, 100, .4), rbinom(70, 100, .7)), trials = 100) # BMix fit with default parameters x = bmixfit(data)#>#>#>#> ℹ Binomials k_B = 1 and 2, Beta-Binomials k_BB = 0; 4 fits to run.#>#> ℹ Bmix best fit completed in 0 mins#>#> [ BMix ] My BMix model n = 100 with k = 2 component(s) (2 + 0) ──────────────#> Bin 1] and 30% [Bin 2], with π > 0.#> Bin 1 with mean = 0.698716861000352.#> Bin 2 with mean = 0.394348591828564.#> ℹ Score (model selection): ICL = 731.74.#> Warning: No data given in input, returning empty plot.#> Warning: Removed 4 rows containing missing values (geom_bar).#> Warning: Graphs cannot be horizontally aligned unless the axis parameter is set. Placing graphs unaligned.

