Plot clinical timeline + posterior times with histogram in days from a chosen date
plot_timing_days.RdPlot clinical timeline + posterior times with histogram in days from a chosen date
Value
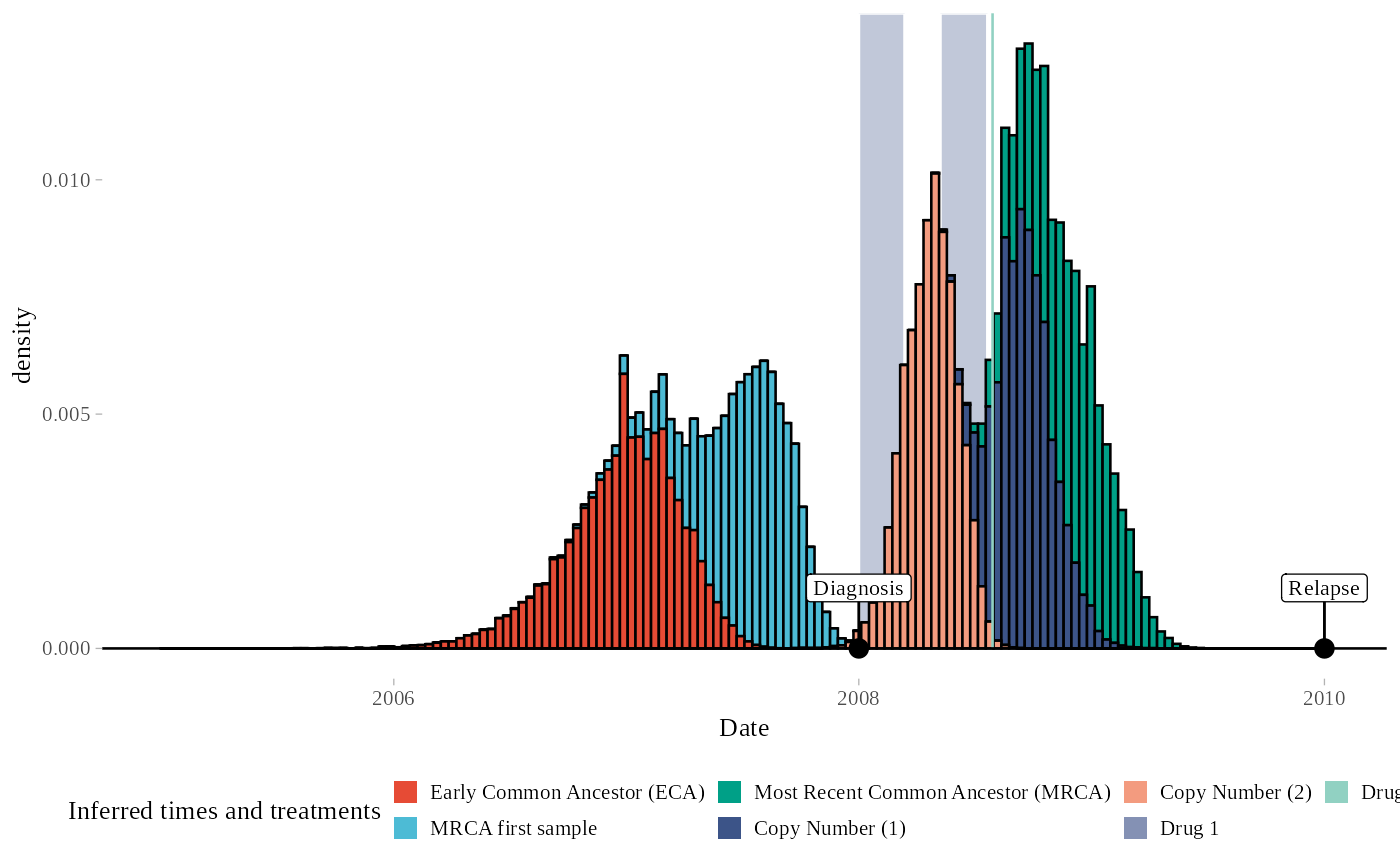
posterior distributions of the inferred timing variables on the clinical timeline (alternative visualisation)
Examples
data("exampleFit")
plot_timing(exampleFit)
#> Warning: Dropping 'draws_df' class as required metadata was removed.
#> No id variables; using all as measure variables